Google Analytics and Yandex.Metrica - large systems. Their interfaces change slowly. And during the work of analytics systems, tools have accumulated that cannot be used now. The rick.ai team collects analytics errors and tells how easy it is to set up analytics against yourself.
Why is the New and Returning Pie Chart interpreted incorrectly?
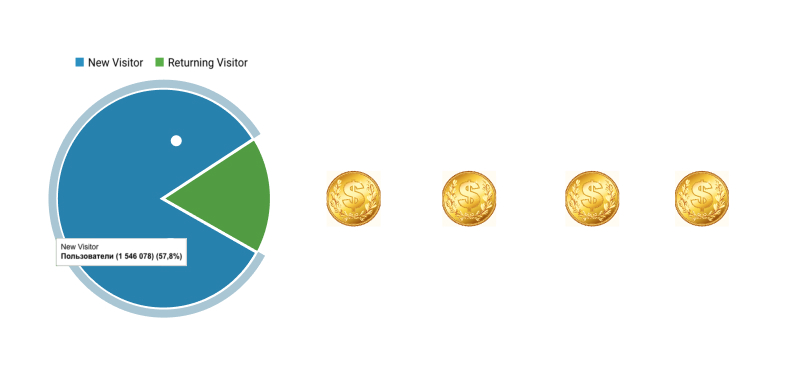
The teams estimate the share of returned users according to the “New and returned” chart. If there are many returning users, there is no need to strengthen or launch remarketing and retargeting, optimize email distribution.

Looking at the chart, marketing and products see that 42.2% of users return again. So, it is not necessary to switch the team’s forces to work on returning to the site. Simple clear conclusion.
On the diagram is written new visitors - new visitors / users. In fact, these are not users. This schedule is built on sessions.
Google Analytics counts sessions, not users.
Users of analytics systems expect that systems can do everything in the world. This is not true.
Ya.Metrika and Google Analytics are actively developing and changing.
See, for example, the API ChangeLog . Many things that are expected to work correctly are morally obsolete, although they will not be removed from the interface for another couple of years.
GA has a standard tool -
GA dev tools Query Explorer. The entire GA interface runs on top of their API. We can generate queries and they will show the same numbers that are shown in the interface.
Let's look at the behavior of the user with the identifier 1000046758.1506757751.
These twenty digits are ga_clientID, a unique user identifier. Writing this identifier to one of the user's variables, the custom dimension allows you to see what's going on inside Google and work with raw data. Without access to raw data, understanding what is happening is almost impossible.
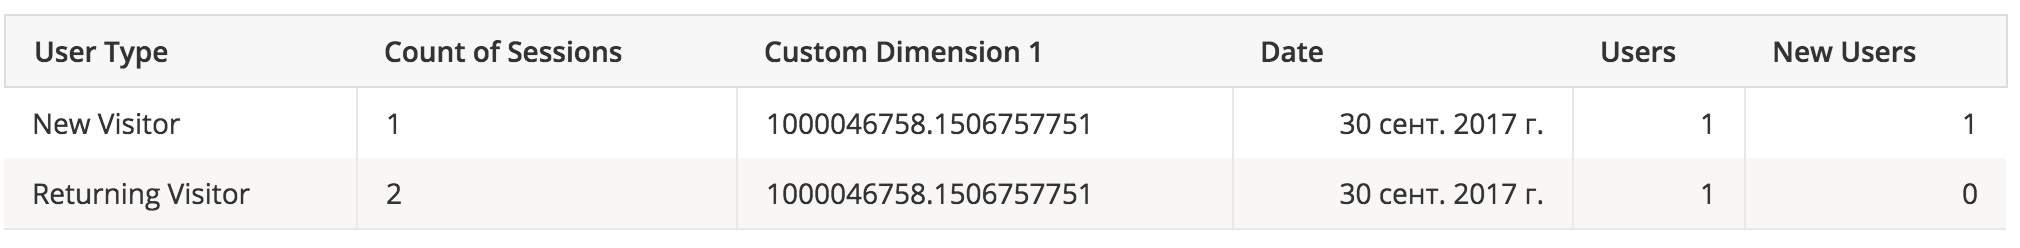
On September 30, user 100 ... 751 had 2 sessions: one registered at New visitors, the other - at Returning visitors. In the first session, the user is new. In the second - returned.
When ga launches new sessions, you can read in the
help :
One user can perform multiple sessions [sessions] that can occur in one day, week, month, or year. A new session can begin only after the previous one is completed, and it ends in the following cases:
By time:
· After 30 minutes of inactivity
· at midnight.
In case of a campaign change:
· If the user has moved to the site by the announcement of one campaign, left it, and then visited again, but already by the announcement of another campaign.
Let's see in GA dev tools Query Explorer what happened to the user 100 ... 751.

At 10:49, a man came in from Google organic, at 10:50 he did some action, 10:50 came back from the channel cardstandart.ru. The payment gateway was redefined as a referral link. The source has changed. And a new session started.
The number of sessions per user is a random variable.
And it does not depend on you
Developers will connect a new gateway, it will be necessary to build an auto linker, do cross domain tracking. But all the same errors will remain. In addition, the user can be distracted by a letter or a call. Chrome error may occur and so on.
The real picture of the return can be viewed in the graph, which is called Cohort analysis. Actually, this is not a cohort analysis, but just retention.
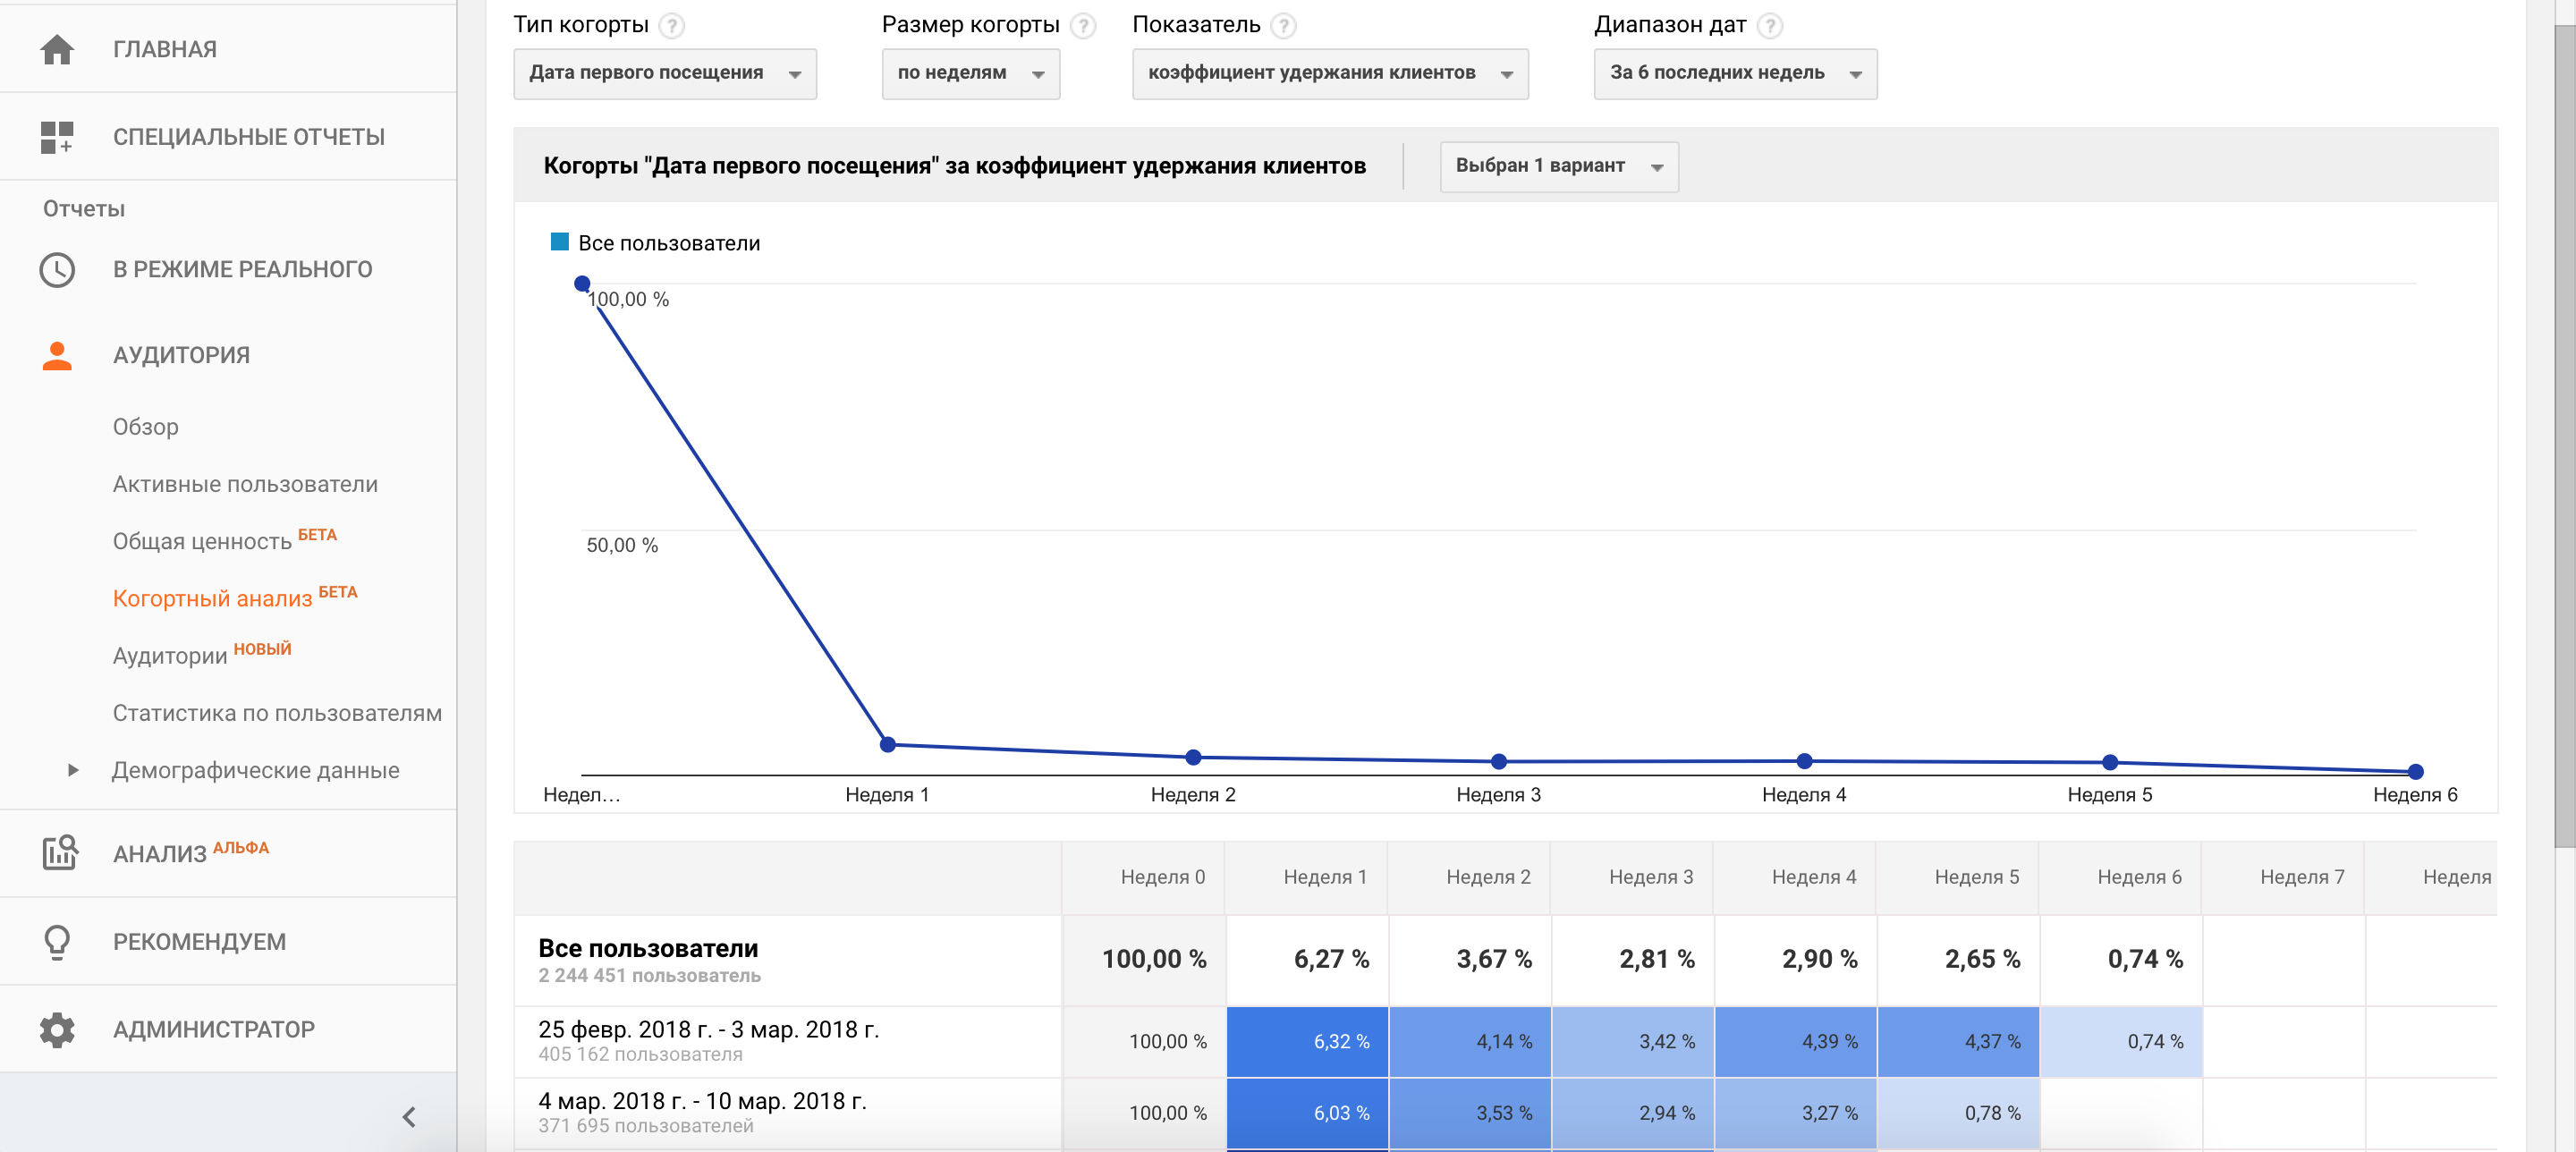
In this graph, we see that 6.27% of users returned to the site in a week.
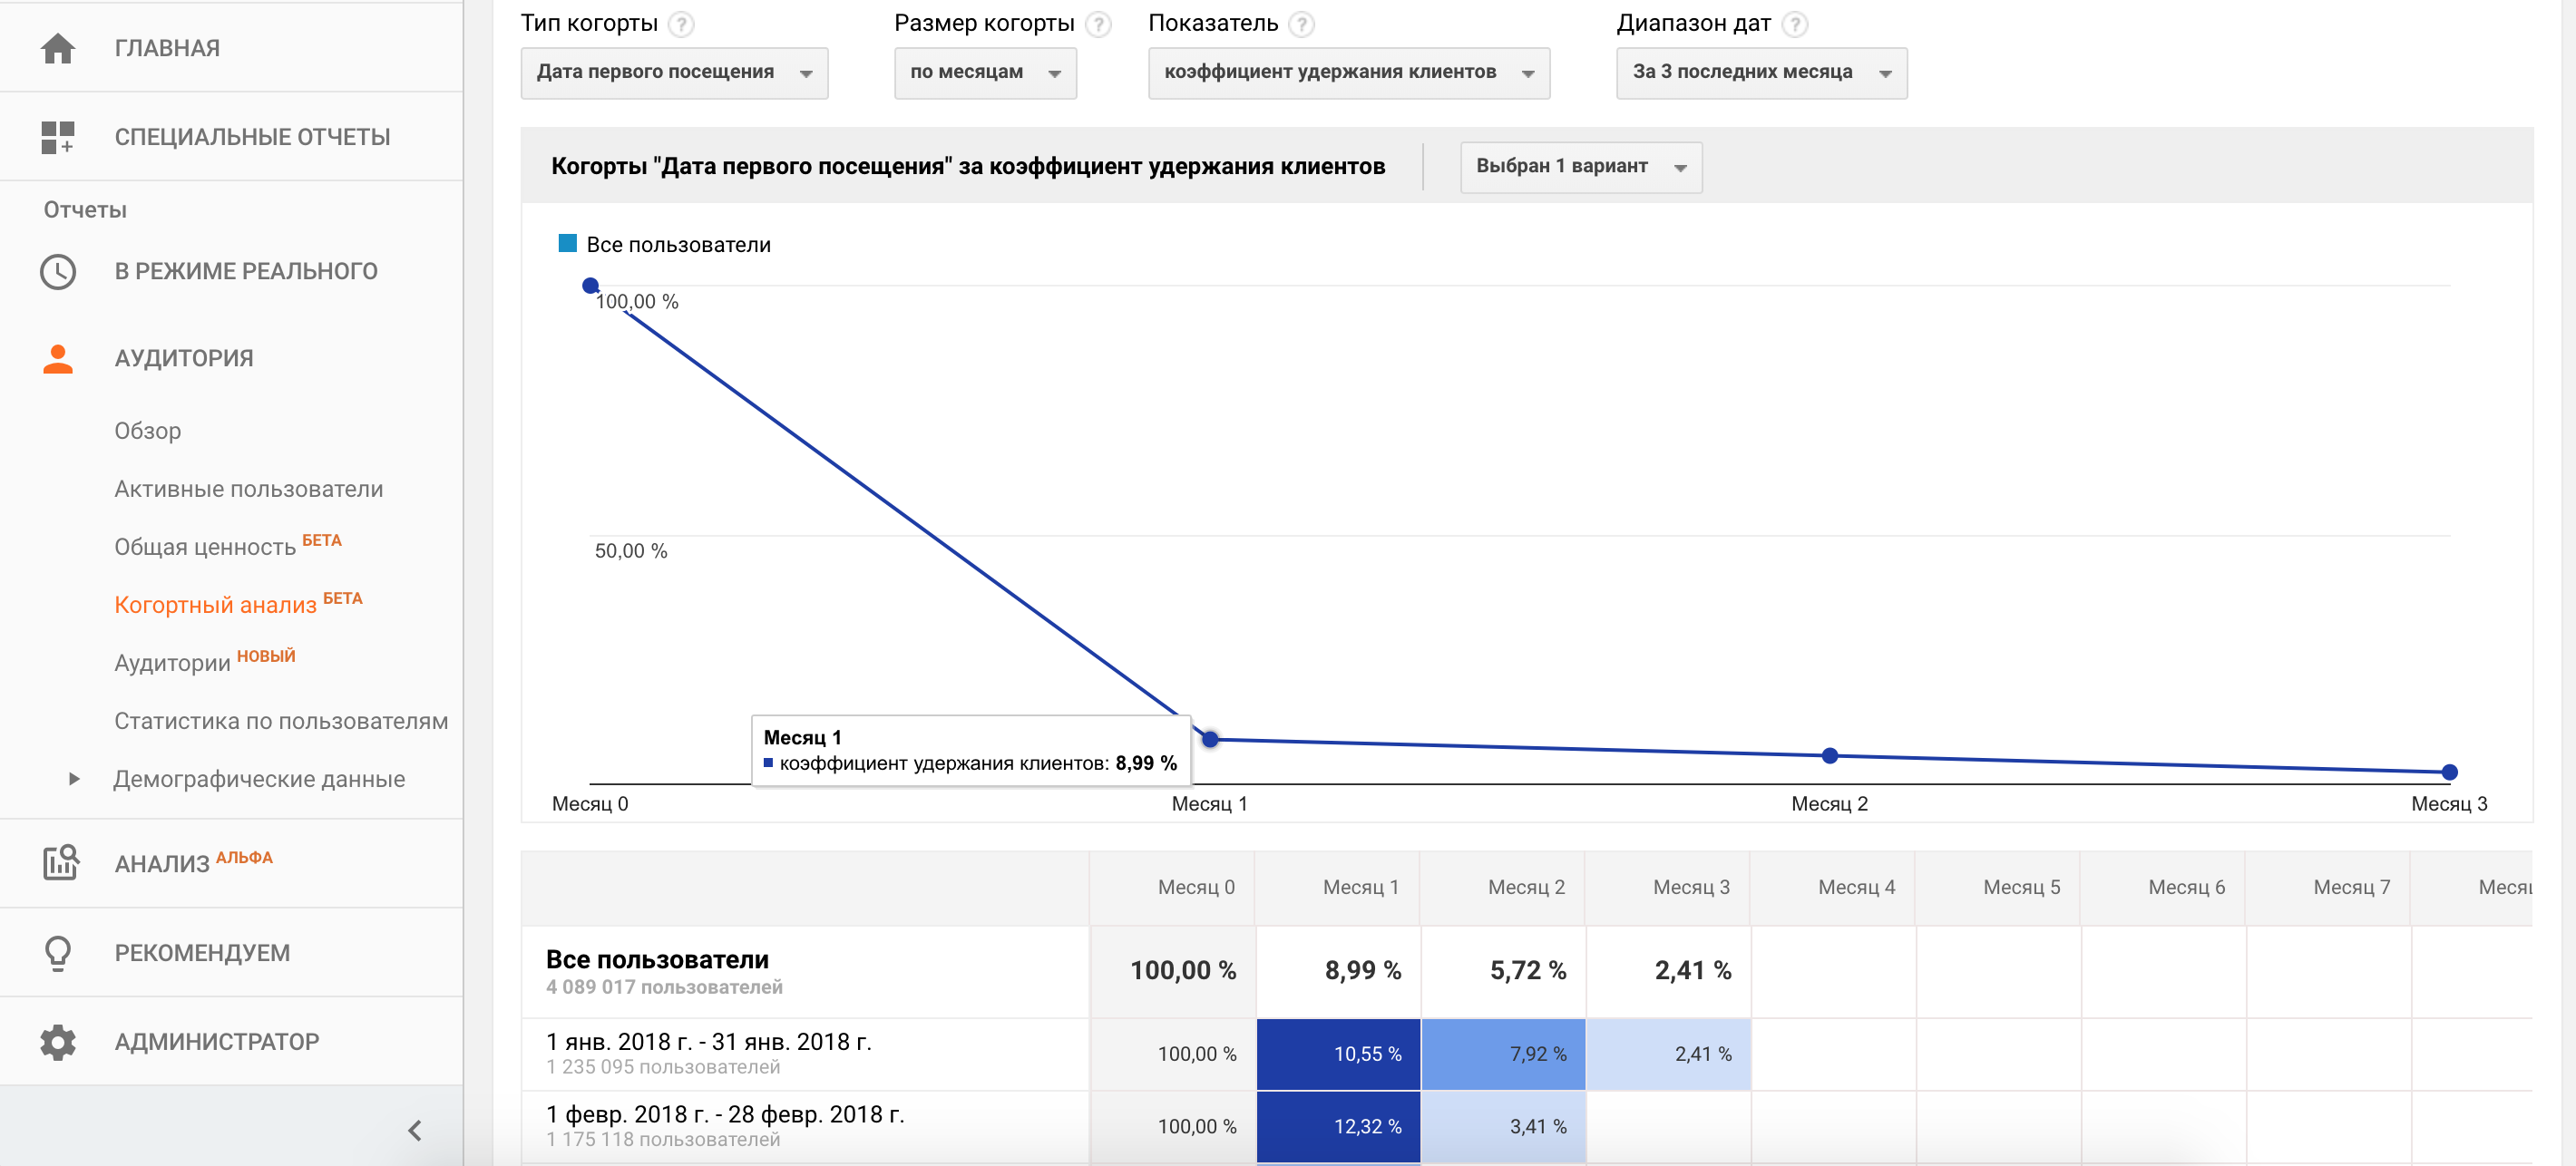
For a month, only 8.99% of users returned to the site. And not 42.2%, as the New and Returning diagram shows. The conclusions of the marketer and the product are reversed: “Few users return to the site, it is necessary to optimize email mailings, to work more actively with remarketing and retargeting.”
Calculation of analytics by session inevitably leads to errors in the conclusions, and ultimately, in the decisions. Because on the site they buy, register and pay not sessions, but users. To consider real users and draw the right conclusions, use user-based analytics.