I continue to acquaint Habr's readers with chapters from my book “The Theory of Happiness” with the subtitle “Mathematical foundations of the laws of meanness”. This is not a published popular science book, very informally telling how mathematics allows you to look at the world and life of people with a new degree of awareness. It is for those who are interested in science and for those who are interested in life. And since our life is complex and, by and large, unpredictable, the emphasis in the book is mainly on probability theory and mathematical statistics. Here theorems are not proved and the fundamentals of science are not given; this is by no means a textbook, but what is called recreational science. But it is this almost playful approach that allows us to develop intuition, brighten up lectures for students with vivid examples, and, finally, explain to nemathematicians and our children what we found so interesting in our dry science.
We will talk about fatum, earthquakes, queues, and wonderful processes: the Poisson stream, random walk, and a little about Markov chains.
Zebra law
They say that life is like a zebra: either a white stripe, or a black one ... And it also happens that another is added to one trouble, and so difficult in life, and then the cat has begun to give birth! That thick, it is empty! One to one! But the saddest thing is that when a bright streak has come and in life, bad thoughts creep in: oh, you wouldn't jinx it, oh, wouldn't you have to pay for your happiness ... A familiar feeling? On this, one of the laws of merphology is formulated - the second law of Chisholm: "
When things are going well, something must happen in the very near future ." But since Francis Chisholm, in his
original work, does not give a detailed analysis or proof of this law, we will try to find out for ourselves whether there is any pattern behind this, or so it only seems to us. And if this is a fad of mathematics, is it possible to determine the characteristic duration or frequency of strips on the body of our zebra, and on what does it depend?
Events happen every now and then. Sometimes they are not at all related to each other, sometimes they form chains of cause-and-effect relationships. Arguments about these connections, chains, and the predestination of life can lead us very far, and we will talk about them later. In the meantime, let's try, as always, to get by with the least amount of basic data for analyzing our law. Consider the sequence of events unrelated to each other, and see what can be obtained from it.
Events that are not related to each other and occur in time are randomly described using a well-known
Poisson stream . It corresponds to many random phenomena from earthquakes to the appearance of buyers in the store. Poisson flow of events is characterized by the
intensity or
density of the flow - a parameter that determines the expected number of events per unit of time. For example, when measuring time in days, the value of the parameter
will correspond to a chain of random events, on average, occurring once a week. This does not mean that events will occur once a week. There can be no allotted frequency for the sequence of events at all. It is best to imagine a Poisson stream with intensity once a week like this: there are 52 weeks in a year, which means there should be about 52 events a year (on average, over many years). If we choose 52 random evenly distributed dates in a year, then they can be considered as moments of the occurrence of completely independent Poisson events.
An example of building a Poisson flow with intensity 1/7 (time is measured in days). On the interval of 365 days, 52 events that were unrelated to each other were randomly scattered.At the same time, any kind of periodicity in these events is not discussed, when they wish, then they will happen. But even in this confusion, statistics can show us certain patterns. For example, the distribution of the duration of the periods between the events shown in the previous figure will not be even.
The density of the distribution of the duration of the intervals between 52 events, randomly scattered over a segment of 365 days.The distribution of the durations of the intervals tends to
exponential , it is shown by a solid line. This distribution has a maximum (mode) at zero, and the average value is just 7 days. Moreover, the standard deviation will also be 7 days. Equality of standard deviation and mean value is a characteristic property of the exponential distribution. As you can see, these characteristics do not guarantee at all that there will be one week between events, on average - yes, but more often - less, besides, quite long intervals can be observed. Finally, the median shows that half of all intervals will have a duration not exceeding 5 days. The intensity and frequency is not the same, this is a very important note!
For justice, we suppose that good and bad events occur equally likely, but bright and significant events occur much less frequently than minor and minor ones. Let it be a normal life in which the emotional coloring of events is subject to a normal (Gaussian) distribution. This is how a year of synthetic fate may look like a series of random, completely independent life's vicissitudes:
A series of events of different emotional colors, forming a Poisson stream with an intensity of 2/7 (2 events in 7 days).While no bands are observed, there is some noise instead. Each event passes without a trace, leaving nothing in memory or in the mood. It does not happen, let's endow our model hero with a memory, for a start, perfect. Let each event ever be bumped into his memory and mood, respectively, either by improving or worsening it. This is the picture we can get by observing the fate of our hero for ten years.
Events, merging in memory, form the emotional coloring of "synthetic life."Well, well, we already see some kind of alternation of mood, but the picture came out not very happy. Our hero after a series of mood swings fell into a deep depression. It's a pity. Let's try some more destinies. All of them experience a series of light and dark stripes, but for a long time they get bogged down either in hopeless longing or in transcendent happiness. This happens, of course, but this is clearly not normal.
A few examples of "synthetic destinies" of people with an ideal memory.Relax, dude!
We described our model fates as a very remarkable process, it is called a
one-dimensional random walk and has a number of unusual properties, among which is
self-similarity , that is, the absence of any characteristic time scale. In addition, having received at its disposal for an unlimited time, a random walk can take you unlimitedly far away, and moreover, it will definitely take you to any predetermined distance about the initial value! Thus, no matter how good your business is, if they are subject to random wandering, they will surely slide to zero and go lower, it's just a matter of time! This famous and instructive law of life received the name of the
player’s curse and its essence can be expressed by a simple maxim:
The optimal strategy in gambling is to own a casino, otherwise you will lose.
We will not dwell on this result, which is already painfully known, but this property of a one-dimensional random walk will still occur.
It seems that the ideal emotional memory is not very good. Our heroes do not forget anything and carefully keep everything in their memory, even the most ancient events! Grief from a broken toy in childhood or joy from a kiss in adolescence affects their mood in old age. Moreover, all subsequent kisses and toys are of the same importance to them. It is necessary to save these poor fellows. Emotions subside with time, grief is dulled, joy, alas, too. Forgetting, in many respects, is like cooling, diffusion or slowing down of movement in a viscous fluid, therefore it is reasonable to model it in a similar way. These processes are called
relaxation processes . We will also give our poor fellows the ability to relax!
Relaxing system returns to equilibrium, and, the faster, the greater the deviation from equilibrium. This property can be modeled by a geometric progression, or an
exponential law . We introduce into our model a new parameter - the speed of forgetting.
. It can be expressed through time (in the readings of our model), for which the level of emotion will decrease quite strongly. For example for
The emotional trace of the event will decrease by an order of two months. And now life has become in a good "striped"!
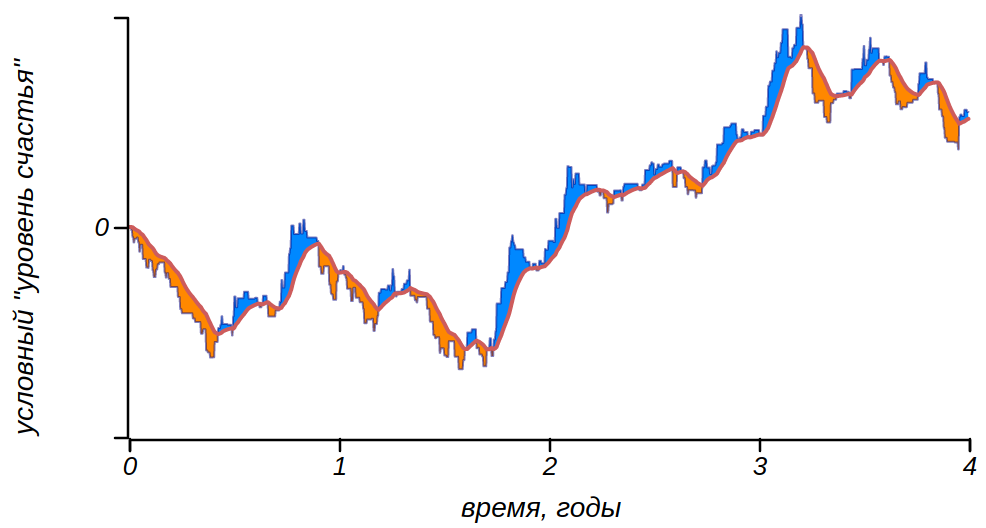
The limitation of memory leads to the fact that a series of events and their traces in memory merge to form a series of emotionally colored bands.By changing the “degree of forgetfulness,” we can get more or less emotionally balanced experimental subjects. It seems that we have found the source of zebra patterns! This is, firstly, random walks, prone to spreading in all directions, and, secondly, healing forgetfulness, which returns the mood to normal. The result is a wave-like mood meandering.
Let's study the properties of the “synthetic” everyday bands we received. We construct a histogram showing the distribution of their durations for a very long life (or for many ordinary ones) with parameters
.
Distribution of durations of periods of happiness and grief for a large number of synthetic destinies. The vertical line is an average value of 33.The first thing that catches your eye is that the distribution maximum (fashion) is near zero, which means that most often the periods of happiness and unhappiness are very short, however, there are also periods of more than a year. On average, the duration of the periods is 33 days, with a standard deviation of 36 days. This distribution is close to exponential (in fact, it is well described by a more general
gamma distribution with parameters that bring it closer to exponential). In turn, the exponential distribution of the durations of bands in life means that mood changes can be viewed as a Poisson flow, that is, as a chain of independent random events that do not have a selected frequency, but occur with a certain known intensity. For example, in the example we have considered, dark and light stripes are replaced with intensity once every 33 days, but at the same time, there are short periods most of all in life: half of them are no longer than ten days.
In the absence of "memory" (for
), the distribution ceases to be exponentially decreasing and becomes a power law.
The distribution of meander durations for a random walk has the character of a power distribution.Statisticians say that such distributions have a
heavy tail , which makes very large deviations from the mean value quite possible, we observed them in the form of long “dives” into that other mood. The distribution obtained by us has one, unusual and strange property — neither the mean value (expectation), nor the standard deviation, nor the median are defined for it. The fact is that all these characteristics are calculated based on the area under the density distribution curve, and it is infinite. In this regard, you can hear that the average value in this case is infinite, but it is not. See what happens when you try to calculate the average value of the meanders of random walk:
An attempt to calculate the average value for a sequence of durations of periods between mood swings in the absence of memory. Emerging extremal values from the heavy tail of the distribution lead to the fact that the mean value does not converge to any value.Huge jumps originating from the heavy tail continually knock down the mean value and the sequence of averages do not converge to any limit. The value of the mean is not infinite at all, it’s just that the integral does not converge to any number or any specific value. It is precisely in the impossibility to calculate the average value of the duration of the meanders that the self-similarity property of a random walk is reflected, namely the absence of any proper time scale.
We simulated adaptability to everyday turmoil with the help of relaxation, or attenuation of emotional outbursts. It is possible to interpret this process in a different way, as the adaptability of a person to life circumstances. When processing noisy signals or sequences, often for smoothing and extracting the useful signal, the moving average method is used, considering at each moment not the signal itself, but the average value of the signal for a certain period of time. Thus, it is possible to get rid of the noise and get an idea of the long-term trends of the signal. Applying such averaging to everyday turmoil, we can simulate human adaptability. And during wars, people fall in love and find a reason for joy, just as the lives of rich idlers are not without a cloud. Shifts the rate from which the mood deviates in one direction or another. Considering the difference between the sequence of emotions and the smoothed line of the background, we get the same pattern, bands, which gave us the previous model, with the same statistical characteristics. This is not surprising, because conceptually they practically do not differ, describing a system with relaxation.
Connected by one chain
In the considered models, we obtained a Poisson mood change flow, generating events by a Poisson flow. This can be seen some fraud - the Poisson random process was “sewn” in the model. How universal is our result? Is it possible to get it somehow differently?
Everyday experience is a poorly formalized piece, and it can be adjusted to fit various mathematical tools, allowing not only simplifying assumptions, but also speculation. In science, this approach is unacceptable, but in our journey through the methods of the theory of random processes, we can afford to play with them to get to know better.
Observing the dynamics of mood and world perception, it can be noted that it is common for a person to “stick” in a certain mood. If things are going well in general, then bad news can be received with optimism. And, on the contrary, a melancholic mood, once swallowing a person, can ruin even good news. From a mathematical point of view, this means that the probability of remaining in the current mood is more likely to change it. This behavior can be described using a random process called the
Markov chain . In the general case, a Markov chain can be represented as a fixed set of states with transitions between them, and, transitions from state to state have a different but known probability. It is convenient to represent such chains in the form of weighted graphs, for example, an elementary symmetric Markov chain describing the dynamics of mood can be represented as follows:
Markov chain with two states ("joyful" and "sad"). Arrows indicate transitions and probabilities of these transitions. In our symmetric case, the probability of remaining in the existing mood exceeds the probability of its change, but does not depend on the mood itself.Our chain is capable of generating sequences of states and, of course, stripes of everyday zebra will appear in it.

The most interesting thing is to find out what distribution will obey the duration of these bands. For our more than simple model, the answer can be obtained exactly — this is the
geometric distribution describing the probability of observing a given number of trials of a random experiment before the first “success”.
The histogram for the durations of periods of the same mood in the sequence generated by the symmetric Markov chain and the probability function of the geometric distribution with a parameter equal to the probability of transition between states. The sequence has a duration of ten years.The geometric distribution is a discrete analogue of the exponential distribution, in the sense that the rounded values of an exponentially distributed random variable obey it. There is a relationship between the geometric distribution parameter and the intensity of the corresponding exponential distribution. Thus, we again get the Poisson mood shift flow, and for the Markov chain we described, its intensity is equal to
.
If we break the symmetry of the chain, then we will be able to describe the “optimist” or “pessimist”, more readily “stuck” in one or another mood. The distribution of the durations of the bands at the same time deviate from the geometric, but at the same time, anyway, most of the bands will be short. and any selected periodicity will not be observed.
The histogram for the durations of the periods of constant mood in the sequence generated by the asymmetric Markov chain. The sequence has a duration of ten years.Markov chains are a powerful tool for analyzing random processes, in which lies a certain algorithm or scenario. They give us a peculiar look at the processes that are commonly considered cyclical. For example, the famous maxim: “the history of mankind walks in a circle” is often interpreted as the fact that there are certain cycles or even periodicities in history. One has to hear, for example, that the beginning of the century promises turmoil and war. Risking not getting into my own subject, I will dare to assume that in fact it makes sense not to speak of literal cycles, but of more or less stable scenarios — regular chains that can be described by the Markov chain. Among Markov chains there is a class of cyclic chains, which, in fact, are capable of creating repetitive sequences. However, there is no real deterministic periodicity in their behavior. Occurring randomly in different historical periods and in different contexts, such cycles are similar to each other, and can create a sense of historical “déjà-vu”. It is useful to study and describe them, but you should not expect a strict calendar plan.
On this we close the theme of the zebra. What conclusions can be drawn from our frivolous research? A series of light and dark stripes in life is not an illusion, they really are. But there are no special patterns in them. Most often they are short, but they are also protracted. It all depends on the lightness of character and the ability to let go of the past. Moreover, if events in life happen rarely, then life will become a gray series of memories disappearing in the past. So it is in our interest to memorize what has been lived, and it is in our power to ensure that life does not become a random walk. We can make the events of good ones become bigger and take place more often, even if they are insignificant. A ski walk, a sincere smile of a passerby, a ticket to a concert, a cup of hot chocolate on a cold day, all this will help create a positive trend and extend the light strip in life. True, following the trend, the average value will be drawn, so that the inevitable sad events will surely change the mood. But do not blame your happiness. This is not a retribution for him, and not the evil eye. This property of relaxing systems is the tendency to oscillations under stochastic external influence.
About waiting for a bus or an earthquake
The difference between the frequency (period) and intensity of the flow of events is quite important to understand when listening to the news or reading the results of scientific research. For example, today, seismologists, alas, cannot predict a specific earthquake: its time, place, and power. On the other hand, long-term seismic forecast methods have been developed for a particular region, but their results are formulated in the language of probability theory, and what to do with them is not always obvious.
For example, for Avachinsky Bay, on the shores of which Petropavlovsk-Kamchatsky is located in 2018,
this forecast is given: “The total probability of earthquakes with a magnitude of more than 7.7, which may be 7-9 points in the city of Petropavlovsk-Kamchatsky, may reach 52.3 in the next five years. %." What does it mean? Tomorrow shake? And when? And where? Alas, we are not yet able to answer such direct questions. The exact interpretation of this message is as follows: the intensity of the seismic flow is now such that in the next 500 years approximately 52 earthquakes will occur (assuming the flow does not change). Moreover, a month later, the forecast may change. Intensity is similar, in some sense, to instantaneous speed of movement: to measure that you are moving at a speed of 60 km / h it is not necessary to travel all 60 km for an hour. And, most importantly, the forecast given by scientists does not mean that ten years pass between earthquakes, as it can be assumed, dividing 500 years into 52 events. Thus, if during ten years there have been no strong earthquakes, then this does not mean that it will happen not today or tomorrow. It will happen, of course, but how long it will have to wait is unknown.
Look at how the level of seismic activity of the Kamchatka region is changing at different time scales (the image is taken from the site of the
Seismic Activity Monitor of the Kamchatka Branch of the Unified Geophysical Service of the Russian Academy of Sciences)
In place of a lower level of activity comes increased, activity "breathes", but not periodically, but like all the same random wandering with relaxation.But earthquakes, nevertheless, are unpleasant phenomena and they shouldn’t happen any longer. There are things that you expect with great impatience, for example, a bus. Coming to a stop, we, of course, want to instantly take the right route of the bus or tram, but, most likely, this is not possible. Then, if there is a clear timetable in this place, we look at it, then at the clock, and then plunge into a book or phone. But often, in the middle of the route, instead of the schedule, the interval of traffic is indicated, for example, 15 minutes. This means that we are already far from the bus station, from which buses leave on time, and some error accumulates, which makes the arrival of the bus a random one. Well, 15, so 15, wait.
And here we must bear in mind that, on average, you will have to wait exactly 15 minutes, regardless of when you come. Now, if the buses came with a frequency of 15 minutes, the average waiting time would be half the period - 7.5 minutes, but with the intensity it will not work! In the absence of additional conditions, the traffic flow is modeled by a Poisson flow, which means that the waiting time for a bus will obey an exponential law with the same intensity. And the expectation for an exponential distributed quantity with intensity equally
Summarize.
Coming to a bus stop, you need to make a clear decision: wait, or go on foot, and think about the topic: wait a while or go on foot — only to doom yourself to meet the law of meanness. For when you, having waited for 17 minutes, spat, and went on foot, you are very likely to be overtaken by the long-awaited bus, or even two. Well, and in order to wait for the bus turned into a tedious and hopeless competition with fate, let us recall the curse of the cyclist from the previous chapter , effectively extending the observed waiting time.Interestingly, the Lorenz curve for the exponential distribution is the same for any intensities. Thus, for all Poisson processes, the statement is true: half of the total observation time falls on 20% of cases when this next event is delayed. The Gini coefficient for the exponential distribution is exactly 1/2.Another queue
I think about the laws of meanness, standing at the airport in the queue for the registration of passengers and baggage. The line is long, people are different and visible with all their bags, children or cells. I hear grunts from behind: “As usual, our turn is slowing down. Look, look, that mustache in a cap stood on a par with us and now there where ... That's the law of meanness! It’s always my turn to be slow! ”This law is called Ettore’s observation:"The next line is always moving faster."
, . , , . , . , , , , .
.
:
, .In turn, the difference between two identical Poisson processes, namely, it is observed by a person bored in the tail, is a kind of random walk. And if so, then we are ready to draw some conclusions. First: the distance between people who simultaneously get into the same queues will either increase or decrease, and characteristic meanders will be formed with a constantly changing duration. The second conclusion: due to the self-similarity of the random walk, both for short queues and for long ones, the meanders will have a duration that is commensurate with standing in line, which means they will be noticeable, and the meanders are a cause for discontent. The third conclusion: it is not known in advance which queue will pass faster, because a random walk equiprobably goes both up and down. And finally, the fourth conclusion: the queues move independently,now and then ahead and overtaking each other, on average, they move in the same way, and the expected difference between them tends to zero, but the spread around the average increases with time (in the case we described, the magnitude of the lag of one queue from another submits ). , — !
, . , ! , , : , , ! , , , .
, , . , .