What is more unpleasant than the "red dough"? The test, which is green, then red, and it is not clear why. At our conference Heisenbug 2017 Moscow,
Andrey Solntsev (Codeborne) talked about why they can arise and how to reduce their number. Examples in his report are such that you really feel the pain when you encounter them. And the tips are useful - moreover, it is worth getting to know them both for testers and developers. There is also the unexpected: you can find out how sometimes you can sort out a problem if you break away from the screen and play cubes with your daughter.
As a result, the audience highly appreciated the report, and we decided not only to publish the video, but also to make a text version of the report for Habr.
In my opinion, flaky tests are the hottest topic in the automation world. Because to the question “what is generally done in the world, how are you doing with automation?” All answer: “There is no stability! Our tests fall periodically. "
You ran a test, it’s green, two more days green, and then you suddenly fell on Jenkins. You try to repeat it, you start it, and it is green again. And in the end you never know: is this a bug or is it just a test bug? And every time you need to understand.
Often, after a nightly launch of tests on Jenkins, the tester first sees "30 tests have fallen, must be studied," but everyone knows what happens next ...

Of course, you guessed it, what an indecent word is disguised: “I will restart”. Like, "today is reluctant to understand ..." This is how it usually happens, and this is just a disaster.
There is no exact statistics, but I often heard from different people that they have about 30% of tests - flaky. Roughly speaking, they launch a thousand, of which 300 are periodically red, and then they check with their hands, and in fact do they fall.
Google has published
an article a couple of years: it says that they have 1.5% of flaky tests, and it is told how they are fighting to reduce their number. I can brag a little and say that now in my project in Codeborne it is now 0.1%. But in fact, all this is bad, even 0.1%. Why?
Take 1.5%, this number seems small, but what does it mean in practice? Suppose a thousand tests are in the project. This may mean that in one build 15 tests dropped, in the next 12, then 18. And this is terribly bad, because in this case almost all the builds are red, and you constantly need to check with your hands if this is true or not.
And even our one ppm (0.1%) is still bad. Suppose we have 1000 tests, then 0.1% means that regularly one build out of ten falls with 1-2 red tests. This is the real picture from our Jenkins, and it turns out: with one launch, one flaky test fell, with another launch another.

It turns out that not a day without a red build does not pass with us. Since there is a lot of green, everything seems to be fine, but the client has the right to ask us: “Guys, we pay you money, and you always supply us with redness! What the heck?"
I would be dissatisfied with the client’s place, and it’s not normal to explain “generally in the industry, everyone’s red”, isn't it? Therefore, in my opinion, this is a very urgent problem, and let us together figure out how to deal with it.
The plan is:
- My collection of unstable tests (from my practice, absolutely real cases, complex and interesting detective stories)
- Causes of instability (some even went away for research)
- How to deal with them? (I hope this will be the most useful part)
So let's start with my collection, which I cherish very much: it cost me many night hours of life and debag. Let's start with a simple example.
Example 1: classic
For starters - classic Selenium script:
driver.navigate().to("https://www.google.com/"); driver.findElement(By.name("q")).sendKeys("selenide"); driver.findElement(By.name("btnK")).click(); assertEquals(9, driver.findElements(By.cssSelector("#ires .g")).size());
- We open the webdriver;
- We find the element q, we drive in the search word;
- Find the element "Button" and click;
- We check that there are nine results in the answer.
Question: which line can break here?
That's right, we all know well that any! Absolutely any line can break, for completely different reasons:
The first line is a slow Internet, the service has fallen, the admins have not configured something.
The second line - the element has not yet had time to draw, if it is dynamically drawn.
What can break in the third line? It was unexpected for me here: I wrote this test for the conference, I ran it locally, and it was on the third line that I fell with this error:

This says that the element at this point is not clickable. It would seem a simple elementary Google-form. The secret was that in the second line we entered a word, and while we entered it, Google had already found the first results, showed some first results in such a pop up, and they closed the next button. And this does not happen in all browsers and not always. I have with this script this happened about once in five.
The fourth line may fall, for example, because this element is drawn dynamically and has not yet had time to draw.
In this example, I want to say that, in my experience, 90% of flaky tests are based on the same reasons:
- The speed of Ajax requests: sometimes they run slower, sometimes faster;
- The order of Ajax requests;
- Speed js.
Fortunately, there is a cure for these reasons!
Selenide solves these problems. How to solve? Let's rewrite our Google test on Selenide - almost everything looks like, only $ signs are used:
@Test public void userCanLogin() { open(“http:
This test always passes. Due to the fact that the setValue (), click () and shouldHave () methods are smart: if something doesn’t have time to paint on them, they wait a bit and try again (this is called “smart expectations”).
If you look a little further, all these should * smart methods are:

They can wait if necessary. By default, wait up to 4 seconds, and this time-out, of course, is configured, you can set any other. For example, like this: mvn -Dselenide.timeout = 8000.
Example 2: nbob
So, 90% of problems with flaky tests are solved with the help of Selenide. But there remain 10% of much more sophisticated cases with complex, confused causes. That's exactly what I want to talk about today, because this is such a “gray area”. I will give one example: a flaky test, which I immediately stumbled upon in a new project. At first glance, this simply cannot happen, and this is what is interesting.
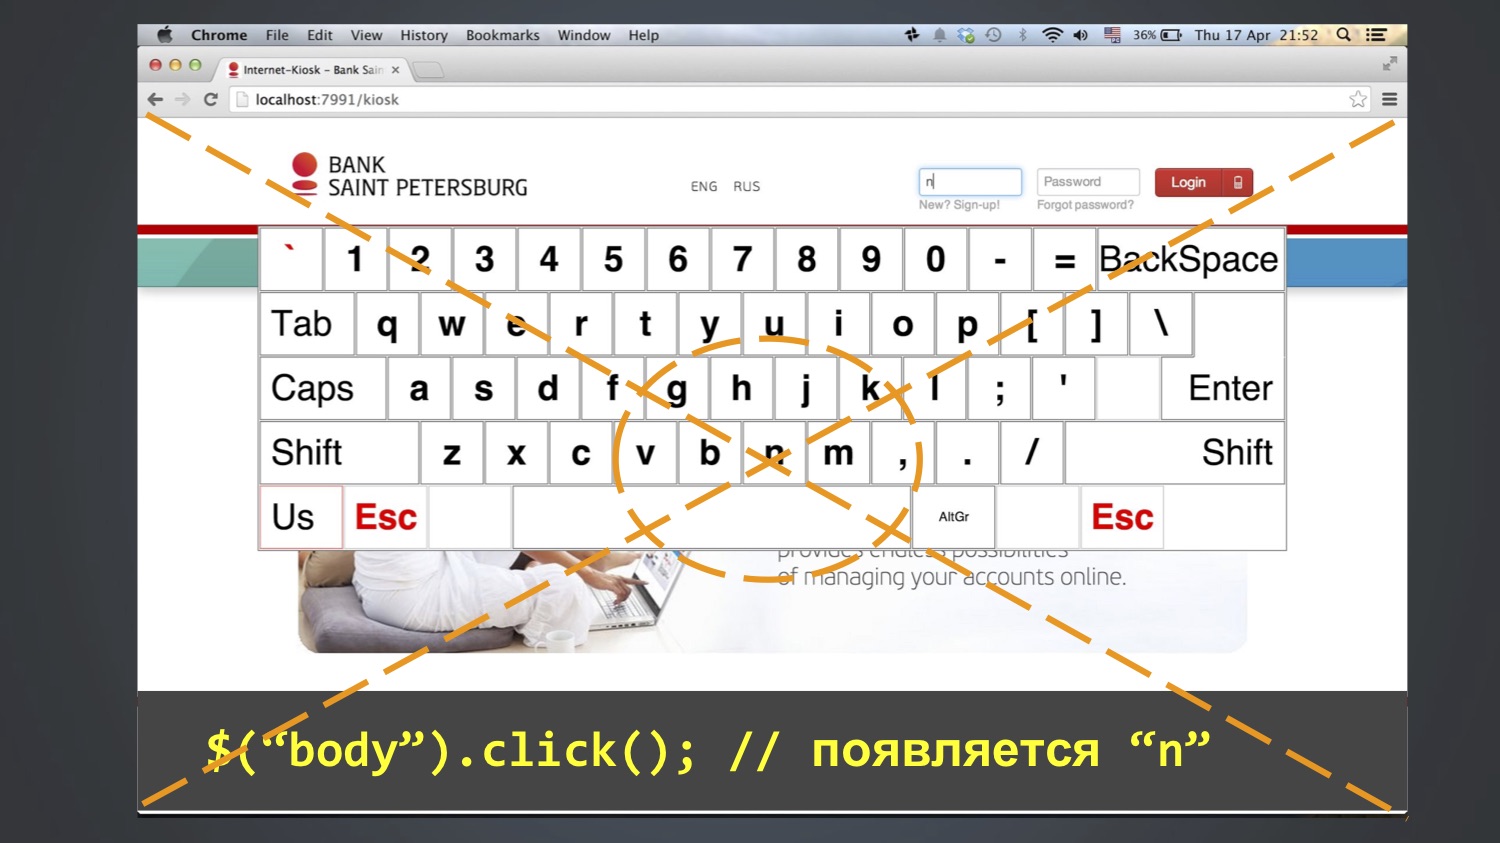
Tested keyboard application for login in kiosks. The test wanted to log in as the user “bob”, that is, in the “login” field enter three letters: bob. To do this, use the buttons on the screen. As a rule, this worked, but sometimes the test fell, and the “nbob” value remained in the “login” field:

Naturally, you search through the code, where we could have written “nbob” - but in the whole project there is no such thing at all (not in the database, not in the code, not even in the Excel files). How is this possible?
We look at the code in more detail - it would seem, everything is simple, no mysteries:
@Test public void loginKiosk() { open(“http:
We began to debug further, to go in steps, and this method was able to be understood: this error sometimes appears after the line $ (“body”). Click (). That is, at this step, “n” appears in the “login” field, then “bob” is added to the subsequent ones. Who has already guessed where “n” comes from?
It so happened that the letter N was in the middle of the screen, and the click () function at least in Chrome works like this: it calculates the central coordinate of the element and clicks on it. Since the body is a large item, it clicked on the center of the entire screen.
And it did not always fall. Who knows why? In fact, I myself do not fully know. Perhaps due to the fact that the browser window all the time opened a different size, and it did not always fall into the letter N.
You probably had a question: why did someone make $ (“body”). Click ()? I also don’t know until the end, but I suppose to remove the focus from the field. There is such a problem in Selenium that click () is there, but unclick () is not. If there is a focus in the field, then there is no way to remove it from there; you can only click on some other element. And since there were no other reasonable elements, clicked on the body, and got this effect.
Hence the moral: you don’t need to embed anything in <body>. In other words, you do not need to make any extra movements in a panic. In fact, this often happens: since I do Selenide, I often receive complaints about “something does not work”, and then it turns out that they had 15 extra lines in the setup methods that do not do anything useful and interfere . No need to fuss and insert anyhow that tests such as "suddenly it will be more reliable."
As a result, expand the list of reasons for unstable tests:
- Speed of Ajax requests;
- The order of Ajax requests;
- JS speed;
- Browser window size;
- Vanity!
And at the same time my recommendation: do not run tests in maximized (that is, do not open the browser in full window). As a rule, everyone does this, and in Selenide it was by default (or is still there). Instead, I advise you to always launch the browser with a strictly defined screen resolution, because then this random factor is excluded. And I advise you to set it to the minimum size that your application supports by specification.
Example 3: phantom accounts
The example is interesting because everything that could coincide immediately coincided here.
There was a test that checked that there should be 5 accounts on this screen.

He, as a rule, was green, but sometimes under unclear what conditions he fell and said that there were not five, but six accounts on the screen.
I began to investigate where the extra bill comes from. Absolutely incomprehensible. The question arose: maybe we have another test, which during the test creates a new account? It turned out that yes, there is such a LoansTest. And between him and the falling AccountsTest (which expects five accounts) there may be a million some other tests.
We are trying to understand how this is so: shouldn't LoansTest, which creates an account, have to delete it at the end? We look at its code - yes, it should, at the end there is a After function for this. Then, in theory, everything should be fine, what is the problem?
Maybe the test removes it, but it remains cached somewhere? We look at the production code that loads the invoices - there really is an @CacheFor annotation in it, it caches the invoices for five minutes.
The question arises: but shouldn't the test have to clear this cache? It would be logical, but can not be such a joint? We look at his code - yes, he really clears the cache before each test. What the heck? There you are already lost, because the hypotheses are over: the object is deleted, the cache is cleared, trees, sticks, what else could be the problem? Then I began to just climb on the code, it took some time, perhaps even a few days. Until I finally looked at this class and superclass, and did not find one suspicious thing there:

Someone has already noticed, right? Quite right: both in the child and in the parent class there is a method with the same name, and it does not call super.
And in Java it is very easy to do: you press the Alt + Enter or Ctrl + Insert combination in IntelliJ IDEA or Eclipse, it defaults to you the setUp () method, and you don’t notice that it overrides the method in the superclass. That is, the cache is still not called. When I saw this, I was wildly angry. This is my joy now.
Hence the moral:
- In tests, it is very important to follow the clean code. If in the production code everyone is attentive to this, they carry out code review, then in tests it is not always.
- If the production code is tested by tests, then who will check the tests? Therefore, it is especially important to use checks in the IDE.
After this incident, I found such an inspection in the IDEA, turned off by default, which checks: if the method is redefined somewhere, but there is no @ Override annotation, then it marks this as an error. Now I always put this tick on hysterically.
Let's recap: how did this happen, why did the test not always fall? First, it depended on the order of these two tests, they always run in random order. Another test depended on how much time passed between them. Accounts are cached for five minutes, if more were passed, then the test was green, and if less, it fell, and this rarely happened.
Expand the list of why tests may be unstable:
- Speed of Ajax requests;
- The order of Ajax requests;
- JS speed;
- Browser window size;
- Application cache;
- Data from previous tests;
- Time.
Example 4: Java Time
There was a test that worked on all of our computers and on our Jenkins, but sometimes fell on the customer's Jenkins. We look at the test, we understand why. It turned out to fall, because when checking "the date of payment must be now or in the past" it turned out to be "in the future."
assert payment.time <= new Date();
We look into the code, suddenly under some conditions we can put a date in the future? We cannot: in the only place where the payment time is initialized, new Date () is used, and this is always the current time (as a last resort, it may be in the past if the test was suddenly very slow). How is that even possible? Long fought his head, could not understand.
And once looked into the application log. Hence the first moral - it is very useful when looking at tests to look into the log of the application itself. Raise your hands, who does it. In general, not the majority, alas. And there is useful information: for example, request log, such and such a URL at such a time was executed, issued such and such an answer.

Is there something suspicious here, noticed? We look time: this request was processed minus three seconds. How can this be? Long fought, could not understand. Finally, when we ran out of theories, we made a stupid decision: a simple script was written to Jenkins, which logs the current time in a loop once a second. Launched it. The next day, when this flaky-test fell at night once, they began to watch an excerpt from this file for the time when it fell:
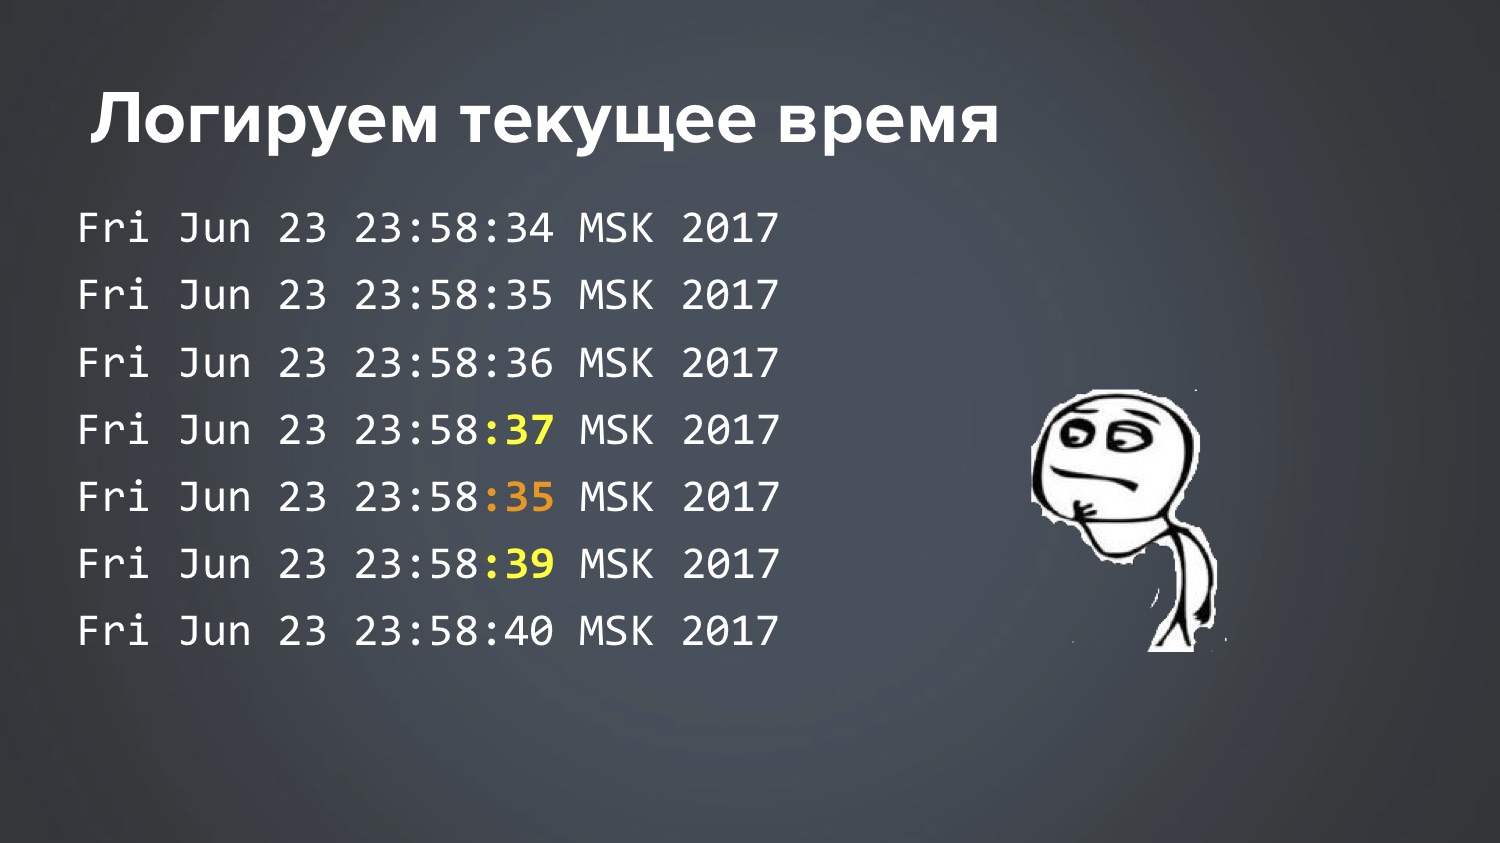
So: 34 seconds, 35, 36, 37, 35, 39 ... Cool, that we found it, but how is this even possible? Again, the theory ended, two more days scratching my head. This is really the case when the Matrix makes fun of you, right?
Until at last one idea struck my head ... And so it turned out. In Linux, there is a time synchronization service that runs to the central server and asks, “how many milliseconds are there now?” And it turns out that two different services were running on this particular Jenkins. The test began to fall when Ubuntu was updated on this server.
There, an ntp-service was previously configured, which applied to a special bank server and took time from there. And with the new version of Ubuntu, the new lightweight service, for example, systemd-timesyncd, was turned on by default. And both worked. No one noticed. For some reason, the central bank server and some central Ubuntu server produced a response with a difference of 3 seconds. Naturally, these two services interfered with each other. Somewhere deep in the Ubuntu documentation it says that, of course, do not allow this situation ... Well, thanks for the info :)
By the way, at the same time I learned one interesting nuance of Java, which, despite my many years of experience, did not know. One of the most basic methods in Java is called System.currentTimeMillis (), it usually records the time to call something, and many people wrote such code:
long start = System.currentTimeMillis();
Such code is in libraries Apache Commons, Guava. That is, if you need to detect how many milliseconds it took to call something, they usually do this. And many have probably heard that it is impossible to do that. I also heard, but did not know why, and it was too lazy to understand. I thought the question was accurate, because System.nanoTime () appeared in some version of Java - it is more accurate, yields nanoseconds, which are a million times more accurate. And since, as a rule, my calls last a second or half a second, this accuracy is not important to me, and I continued to use System.currentTimeMillis (), which we saw in the log where it was -3 seconds. So, in fact, the right way is this, and now I found out why:
long start = System.nanoTime();
In fact, this is written in the documentation of the methods, but I just never read it. All my life I thought that System.currentTimeMillis () and System.nanoTime () are the same thing, but with a difference of a million times. But it turned out that these are fundamentally different things.
System.currentTimeMillis () returns the actual current date — how many milliseconds have passed since January 1, 1970. And System.nanoTime () is an abstract counter that is not tied to real time: yes, it is guaranteed to grow every nanosecond by one, but it is not related to the current time, it can even be negative. When you start the JVM, a moment of time is somehow randomly selected, and it starts to grow. This was a surprise for me. For you too? Here, for good reason arrived.
Example 5: Curse of the green button
Here we have a test that fills in some form, presses the green Confirm button, and sometimes it does not go further. Why does not go - it is not clear.
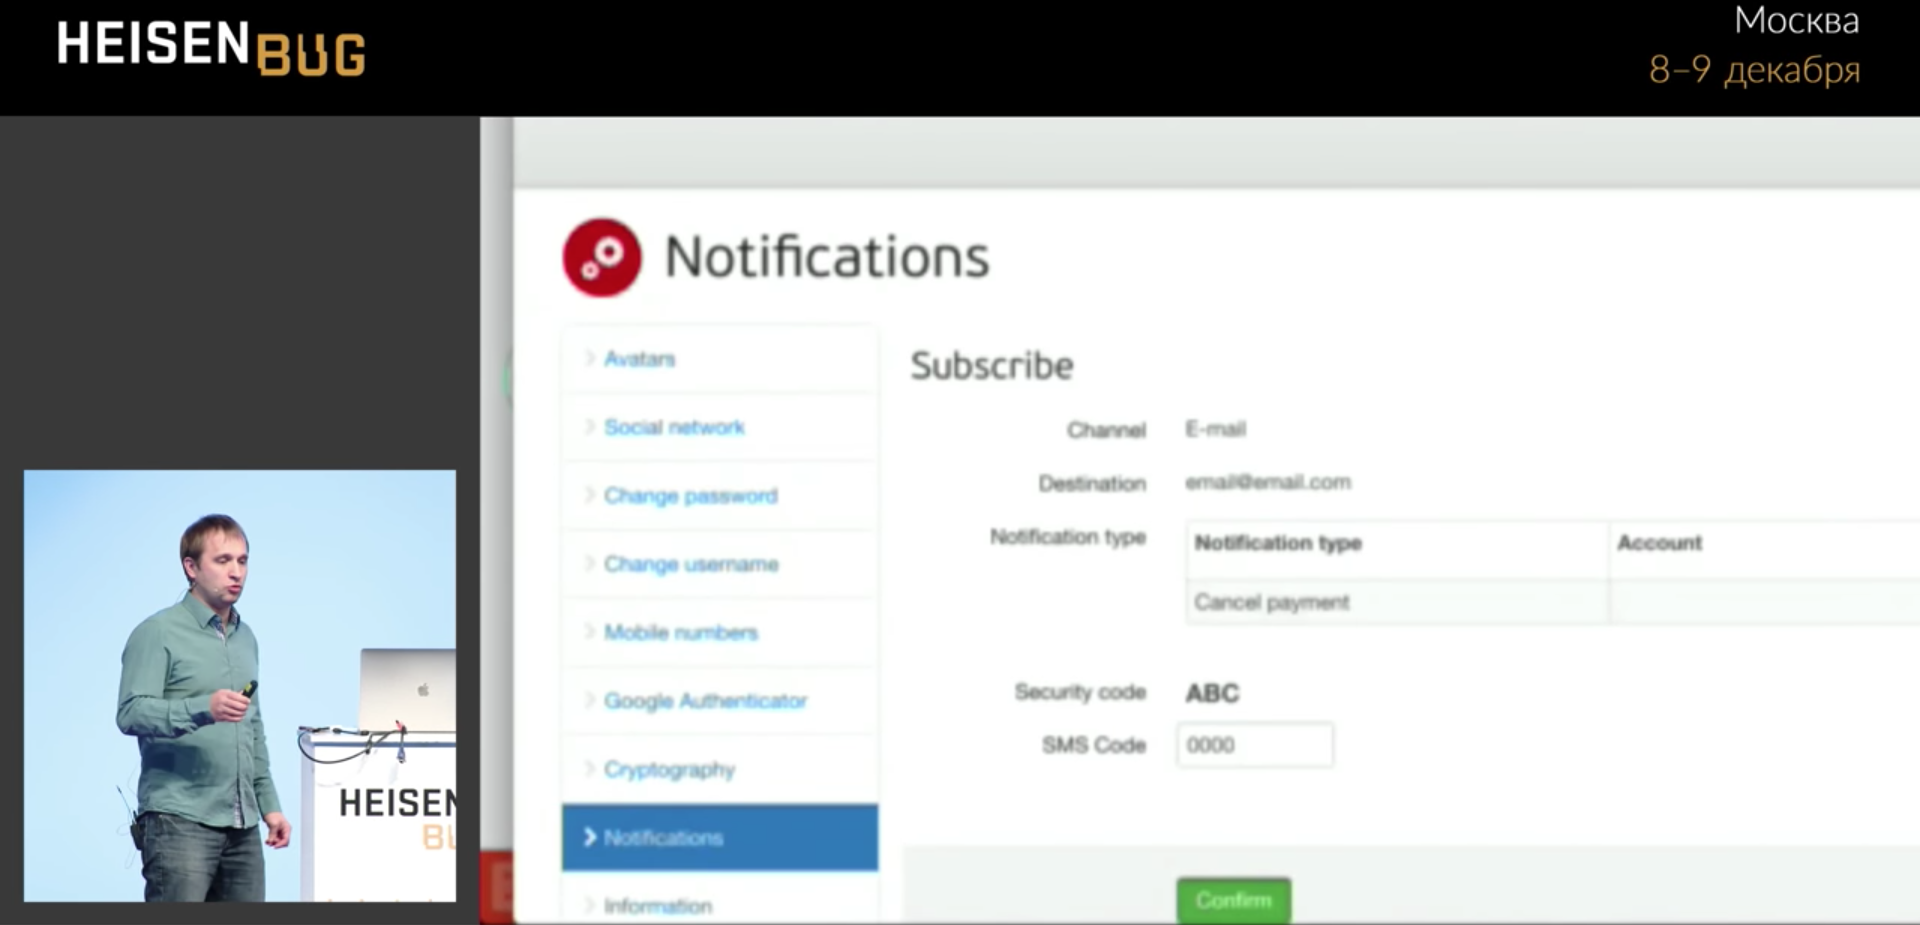
We drive in four zeros and hang, do not go to the next page. Click occurs without errors. I looked at everything: Ajah requests, wait, timeouts, application logs, cache - I did not find anything. Until the library
Video Recorder , written by Sergei Pirogov. She allows, having added one annotation to the code, to record video. Then I was able to shoot a
video of this test, watch it in slow motion, and this finally clarified the situation, which I could not unravel for several months before the video.

The progress bar blocked the button for a split second, and the click worked exactly at that moment and hit the progress bar. That is, the progress bar shaval click and disappeared! And it will not be visible in any screenshot or in one log, you never know what happened.
In principle, this is in some sense the application bug: the progress bar appeared, because the application really climbs over the edge of the screen, and if you scroll, there is a lot of useful data. But users did not complain about this, because on the big screen everything fit, did not fit only on a small one.
Example 6: Why does Chrome hang?
Detective investigation two years long, absolutely real case. The situation is this: our tests were quite often flaky and falling, and in the stack trace it was obvious that Chrome was hanging: not our test, but Chrome. The logs showed “Build is running 36 hours ...” They began to remove thread dumps and stack-traces - they show that everything is good in tests, the call to Chromedriver hangs and, as a rule, at the moment of closing (we call the close method, and this method does nothing, hangs 36 hours). If it’s interesting, the stack trace looks like this:

Tried to do everything that could come to mind:
- Configure the timeout for opening / closing the browser (if we were unable to open / close the browser in 15 seconds, try again after 15 seconds, up to three attempts). Open and close the browser in a separate thread. Result: all three attempts hung the same way.
- Kill old chrome processes. We created a separate jobs in Jenkins 'kill-chrome', for example, this is how you can "kill" all processes older than an hour:
killall --older-than 1h chromedriver
killall --older-than 1h chrome
It even freed the memory, but did not give an answer to the question "what is happening?". In fact, this thing just drew us a moment of decision. - Enable debug-logs of the application.
- Enable WebDriver debug logs.
- Reopen browser after every 20 tests. It may seem ridiculous, but the thought was: “What if Chrome freezes because he is tired?” Well, a memory leak or something else.
The result of the last attempt was completely unexpected: the problem began to repeat more often! And we hoped that this would help stabilize Chrome so that it would work better. This is generally the removal of the brain. But in fact, when the problem begins to repeat more often, one should not be sad, but rejoice! This makes it possible to study it better. If she began to repeat more often, you need to cling to it: “Yes, yes, now I will add something else, logs, breakpoint ...”
We are trying to repeat the problem: we write a cycle from 1 to 1000, in the cycle we simply open the browser, the first page in our application and close it. They wrote such a cycle, and ... bingo! Result: the problem began to repeat steadily (albeit, approximately every 80 iterations)! Cool! True, this achievement did not give anything for a long time. You started, waited for the 80th iteration, Chrome hung ... and then what to do? You look at stack-traces, dumps, logs - there is nothing useful there. Developer Tools in Chrome might have helped, but until September 2017, together with Selenium, these tula did not work (the ports clashed: you launch Chrome from Selenium, and DevTools do not open). For a long time could not think of what to do.
And here in this story begins a fabulous moment. Once, after an infinite number of attempts, I started these tests again, I’ve got it again at some iteration like the 56th one is hanging, I think “let's dig some more” (though I don’t know where else to break it or what add a log). At this moment, my daughter suggests playing cubes, and here the test just hung. I say “Wait,” she told me: “You don't understand, I’m here
to have a b & c !”
What to do, sadly left the computer, went to play cubes ... And suddenly, after about 20 minutes, I casually glance at the screen, and I see a completely unexpected picture:

What happens: there is a countdown, after how many minutes the session will expire, and I build a tower of cubes, two remain, one ... the session expires, the test continues, runs to the end and falls (there is no element anymore, the session has expired).
What turns out: Chrome actually did not hang, as we thought all this time, it has been waiting for something all this time. When the session expired, I waited, I went on. What Chrome was waiting for - absolutely incomprehensible, in order to understand this, I had to shovel all the code with the binary search method: throw out half of JavaScript and HTML, try again to repeat 80 iterations - it didn’t hang, oh, it means somewhere there ... In general, we understood experimentally What is the problem here:
var timeout = setTimeout(sessionWatcher);
JavaScript — , , . , JavaScript- , : , <script> . , , , , . JavaScript — jQuery, $, function , :
var timeout; $(function() { timeout = setTimeout(...); });
This is the ABC of web programming, everyone probably knows. And we did not have it, we had it wrong. When I changed it and repeated the experiment at 1000 iterations, it no longer hung.True, I do not fully know all the answers: for example, I don’t know why it didn’t hang all the time, and only sometimes very rarely. Maybe this is a Chrome bug, damn it. Yes, it really took two years to research this problem., flaky- , , , . , — , , ( ). , . , : ?
Chrome flaky-: -, , , .
Sometimes UI-effects also affect: you want to click on the button, and she at this moment goes or goes from one corner to another. You call the click () method, it calculates the coordinates of the center point of this button and it goes there, and the button has already left at that time. And, most importantly, what happens: the click () method worked without errors, and you do not find yourself on the next page. Someone again clicked, right? :)
. , , , . , , , , Docker.
, - , . :
- Ajax-;
- Ajax-;
- JS;
- ;
- ;
- ;
- ;
- ;
- UI-;
- ( ).
flaky- , . , -, : , .
. «» . , flaky- , ID, flaky- . .
, : , , .
It often happens that the flaky test speaks of a problem with usability, as with a progress bar, where part of the screen was closed and the flaky test showed it. So sometimes you need to look at a falling test from such an angle.The trouble is that if you do not justify properly, then no one will fix anything ... Quite recently we had a case where we began to dig, we realized that the flaky test found a security bug that normal tests did not notice. But I will not tell today, because it has not yet been repaired!Let's talk about what you can do to minimize the number of flaky tests:- Pyramid testing;
- Selenide;
- Service emulators;
- Clean the base before each test.
— . flaky- , unit- , UI-? , ( ), , flaky.
Selenide .
. (, / ). , « ?». , , .
, .
, . , , , , . : « », , (10 , 20 , — , — ). , flaky - .
, flaky- :
- ;
- ;
- Video.
« » , , , : - . «», «» , : flaky-, , flaky. , , . . , Jenkins pipeline, Jenkins :
finally { stage("Reports") { junit 'build/test-results/**/*.xml' artifacts = 'build./reports/**/*,build/test-results/**/*,logs/**/*' archiveArtifacts artifacts: artifacts } }
finally , . : - - . Jenkins , . , Jenkins , . , .
(Selenide , ). flaky-. ,
Video Recorder , :
video — , !
An alternative for those who are ready to run tests in Docker: there is a good library of TestContainers (there was a report about it on this Heisenbug ). There, you also insert one Rule into the test , one annotation - before the test, she herself unfolds the Docker with the correct browser version, records the video, and at the end of the test kills him. In this case, you will also have a video about the dropped test. @Rule public BrowserWebDriverContainer chrome = new BrowserWebDriverContainer() .withRecordingMode(RECORD_ALL, new File("build")) .withDesiredCapabilities(chrome());
The final message.First I want to contact the developers. Developers, dear, be sure to participate in testing, help write tests, investigate, help interested testers read the logs. Because they will never cope with such flaky tests in their lives without you.Managers, bosses of these developers! As a rule, you have a problem :) Allow developers and encourage developers to participate in testing. If you don’t do this, if you say “they don’t have time for it, they have to write code, they are expensive,” then you are wasting money on automation because the automation efficiency will be low.— , , , , - . — , … ! :) flaky- — : !
, : 6-7 Heisenbug . , , . (, , ) .