Content- Prehistory
- Statistics collection
- Statistics display
- Visualization and statistics
- Scan
- Conclusion
Prehistory
Hi habr, telegrams are now at the peak of popularity, all the scandals, intrigues, locks revolve around him, in connection with which telegrams rolled out his proxy version called MTProto Proxy which is designed to help with the bypass of blocking. However, the telegram-provided services for monitoring MTProto Proxy do not provide an opportunity to observe the statistics in real time and collect it to monitor its changes, so we will solve the problem on our own.
Statistics collection
The official MTProto Proxy page on the
Docker Hub indicates that we can use the
docker exec mtproto-proxy curl http://localhost:2398/stats to get statistics directly from the MTProto proxy that is in the container, so our code will look like this.
package main import ( "io/ioutil" "net/http" "strings" "time" ) type User struct { Num string } var Users User func CurrenUsers() (err error) {
total_special_connections indicated on the same
Docker Hub as the number of incoming client connections
Statistics display
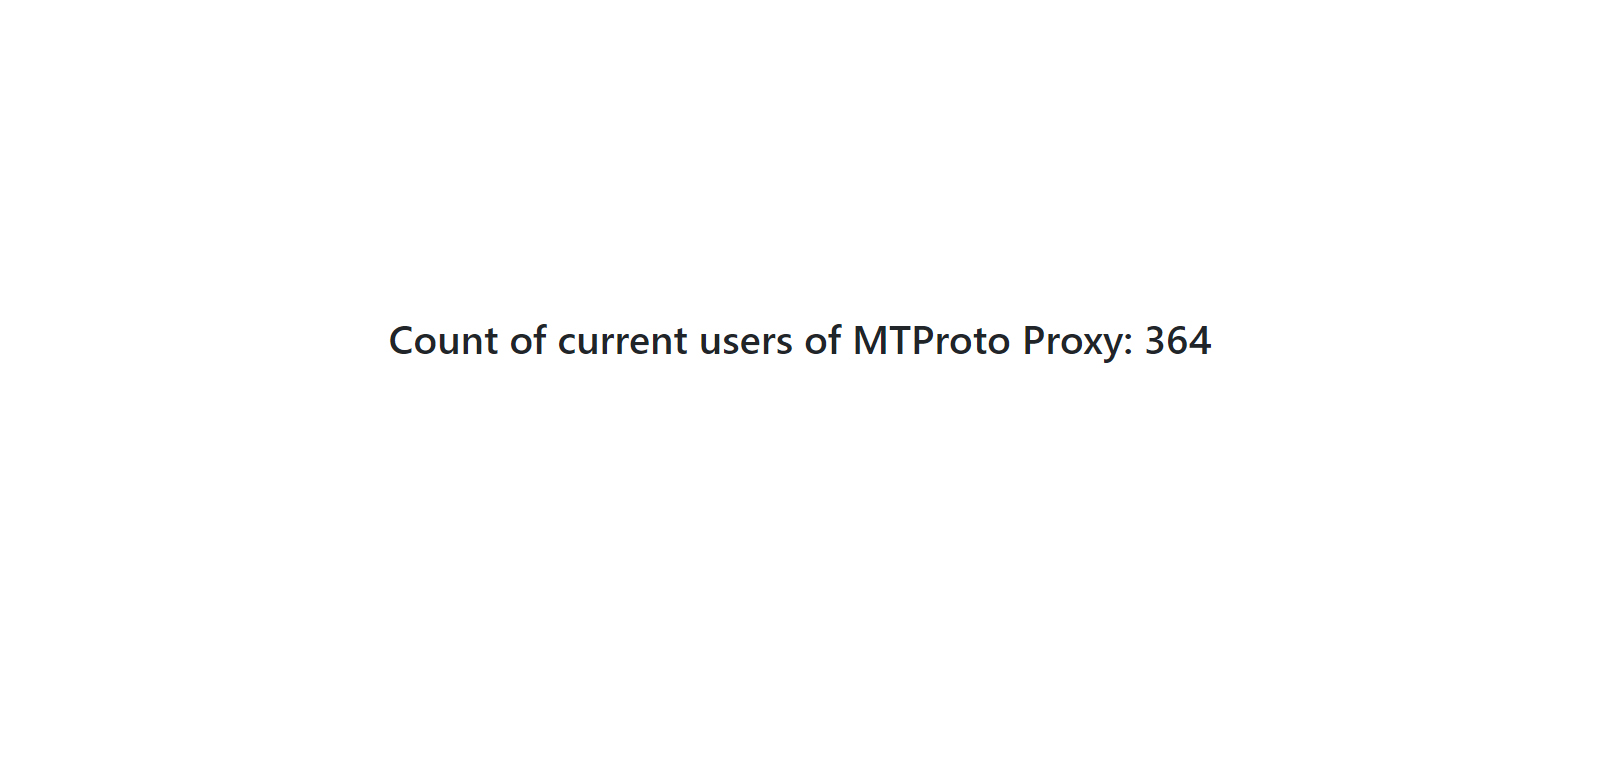
Next, we need to display the current number of users in a simple and convenient form, we will display it in a browser.
package main import ( "html/template" "io/ioutil" "net/http" "strings" "time" ) type User struct { Num string } type HTML struct { IndexPage string } var Users User var IndexTemplate = HTML{ IndexPage: `<!DOCTYPE html> <html> <head> <link rel="stylesheet" href="https://stackpath.bootstrapcdn.com/bootstrap/4.1.0/css/bootstrap.min.css" integrity="sha384-9gVQ4dYFwwWSjIDZnLEWnxCjeSWFphJiwGPXr1jddIhOegiu1FwO5qRGvFXOdJZ4" crossorigin="anonymous"> <title>Stats</title> <meta name="viewport" content="width=device-width, initial-scale=1, shrink-to-fit=no"> </head> <body> <div class="container-fluid"> <div class="row justify-content-center text-center" style="margin-top: 20%"> <h1>Count of current users of MTProto Proxy: {{.Num}}</h1> </div> </div> </body> </html>`, } func CurrenUsers() (err error) {
what is initinit will be called anyway before calling main
Now, by going to the IP address of our MTProto Proxy, we can see the current number of clients.
Visualization and statistics
There are many options for visualizing and maintaining statistics
Datadog ,
Zabbix ,
Grafana ,
Graphite . I will use Datadog. Using the
go get -u github.com/DataDog/datadog-go/statsd command, we import the
statsd library and use it in the code.
package main import ( "html/template" "io/ioutil" "net/http" "os" "strconv" "strings" "time" "github.com/DataDog/datadog-go/statsd" ) var ( datadogIP = os.Getenv("DDGIP") tagName = os.Getenv("TGN") t, _ = strconv.Atoi(os.Getenv("TIMEOUT")) timeout = time.Duration(t) * time.Second ) type User struct { Num string } type HTML struct { IndexPage string } var Users User var IndexTemplate = HTML{ IndexPage: `<!DOCTYPE html> <html> <head> <link rel="stylesheet" href="https://stackpath.bootstrapcdn.com/bootstrap/4.1.0/css/bootstrap.min.css" integrity="sha384-9gVQ4dYFwwWSjIDZnLEWnxCjeSWFphJiwGPXr1jddIhOegiu1FwO5qRGvFXOdJZ4" crossorigin="anonymous"> <title>Stats</title> <meta name="viewport" content="width=device-width, initial-scale=1, shrink-to-fit=no"> </head> <body> <div class="container-fluid"> <div class="row justify-content-center text-center" style="margin-top: 20%"> <h1>Count of current users of MTProto Proxy: {{.Num}}</h1> </div> </div> </body> </html>`, } func (u User) convert() int64 { num, _ := strconv.Atoi(u.Num) return int64(num) } func CurrenUsers() (err error) {
It remains to collect all the docker image
FROM telegrammessenger/proxy COPY mtproto_proxy_stat . RUN echo "$(tail -n +2 run.sh)" > run.sh && echo '#!/bin/bash\n./mtproto_proxy_stat & disown' | cat - run.sh > temp && mv temp run.sh CMD [ "/bin/sh", "-c", "/bin/bash /run.sh"]
Scan
First we need to run the container with the Datadog agent.
docker run -d --name dd-agent -v /var/run/docker.sock:/var/run/docker.sock:ro -v /proc/:/host/proc/:ro -v /sys/fs/cgroup/:/host/sys/fs/cgroup:ro -e DD_DOGSTATSD_NON_LOCAL_TRAFFIC=true -e DD_API_KEY=_ datadog/agent:latest
IMPORTANT in order for us to send our data to the agent, you must set the value to
true for the environment variable
DD_DOGSTATSD_NON_LOCAL_TRAFFICNext, using the
docker inspect dd-agent we need to look at the IP of the container to send data to it.

and run our MTProto Proxy by connecting it with a bridge to the agent container
docker run -d -p 443:443 -p 80:80 -e WORKERS=16 -e DDGIP=172.17.0.2 -e TGN=mtproto:main --link=dd-agent --name=mtproto --restart=always -v proxy-config:/data trigun117/mtproto_proxy_stat
And after a couple of minutes, we can already build a graph by selecting the desired metric and source (the tag that is specified when launching the container with MTProto Proxy)
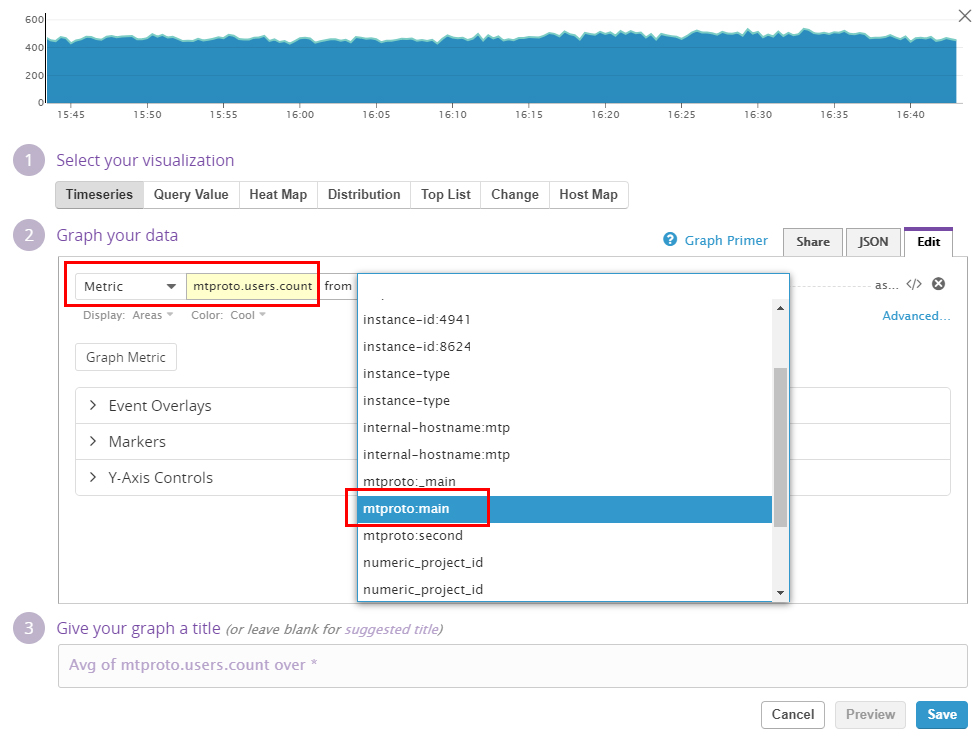
and display our statistics on it
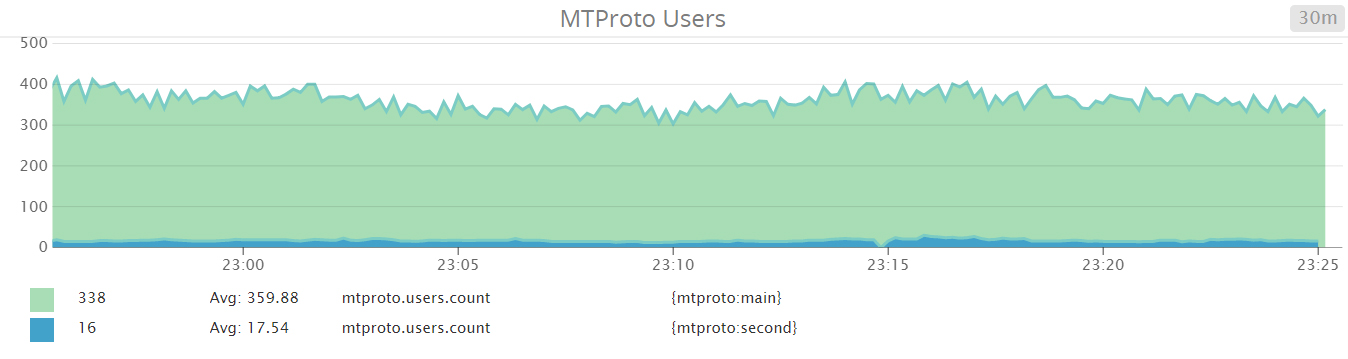 Living example
Conclusion
For myself, I discovered new tools for convenient work with data, I became acquainted with their great diversity and chose something suitable for your taste.
Thank you for your attention, I invite everyone to share their opinions, comments and suggestions in the comments.
Github repository