 Hello! My name is Marco, I work in Badoo in the Platform department. We have a lot of things written on Go, and often these are critical to system performance. That is why today I offer you the translation of an article that I really liked and I am sure it will be very helpful to you. The author shows step by step how he approached performance problems and how he solved them. Including you will get acquainted with the rich toolkit available in Go for such work. Enjoy reading!
A few weeks ago I read the article “
Good code versus bad code in Go ”, where the author step by step demonstrates the refactoring of a real application that solves real business problems. It focuses on transforming “bad code” into “good code”: more idiomatic, more comprehensible, fully using the specifics of the Go language. But the author also stated the importance of the performance of the application in question. Curiosity leaped into me: let's try to speed it up!
The program, roughly speaking, reads the incoming file, parses it line by line and fills objects in memory.
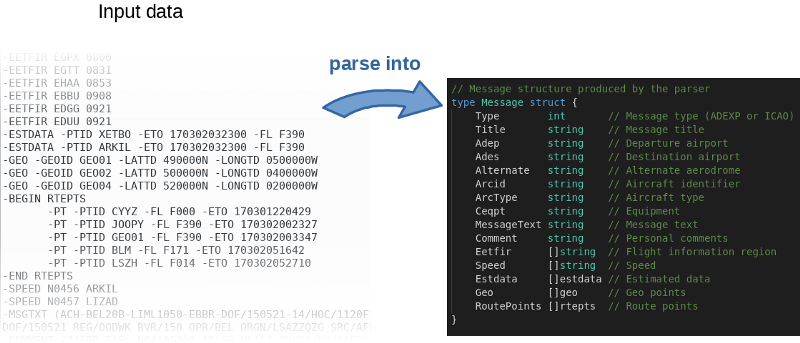
The author not only posted the
source code on GitHub , but also wrote a benchmark. This is a great idea. In fact, the author invited everyone to play around with the code and try to speed it up. You can reproduce the results of the author by the following command:
$ go test -bench=.
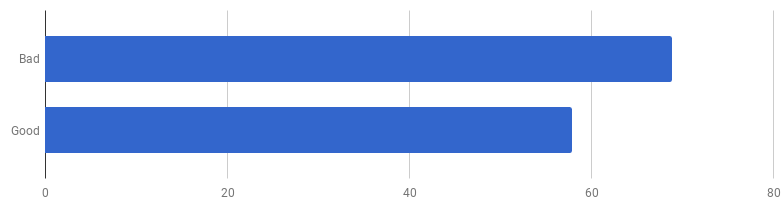 μs on call (less — better)
It turns out that “good code” is 16% faster on my computer. Can we speed it up?
In my experience, there is a correlation between code quality and performance. If you successfully refactored the code, made it cleaner and less connected, you most likely made it faster as it became less cluttered (and there are no more unnecessary instructions that were previously executed in vain). Perhaps, during refactoring, you noticed some optimization options, or now you simply have the opportunity to make them. But on the other hand, if you want to make the code even more productive, you may have to get away from simplicity and add different hacks. You really do miss the milliseconds, but the quality of the code will suffer: it will become harder to read it and talk about it, it will become more fragile and flexible.
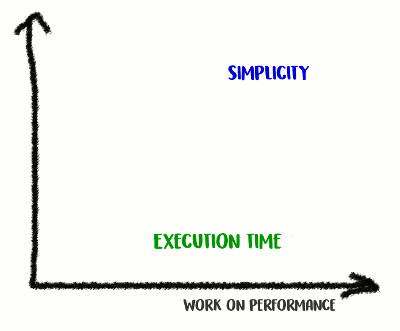 Climb up the mountain of simplicity and then go down from it
This is trade-off: how far are you ready to go?
In order to properly prioritize work on acceleration, the optimal strategy is to find and focus on bottlenecks. To do this, use the tools for profiling.
pprof and
trace are your friends:
$ go test -bench=. -cpuprofile cpu.prof $ go tool pprof -svg cpu.prof > cpu.svg
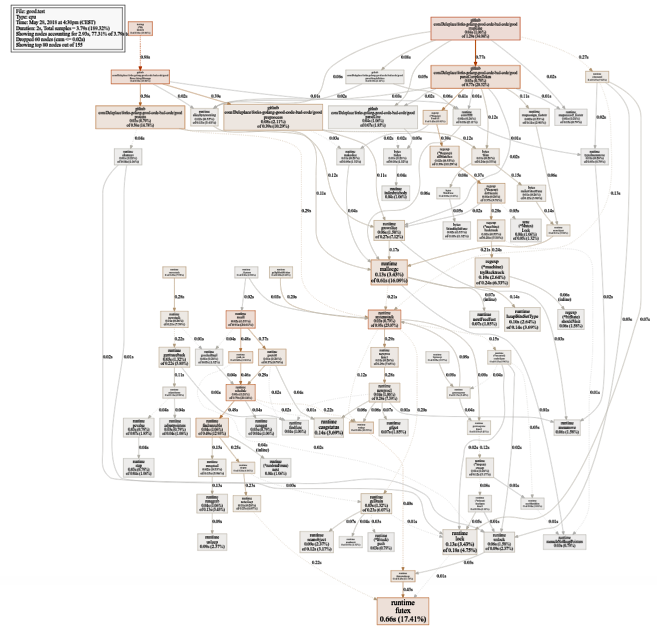 Quite big CPU usage schedule (click for SVG)
 $ go test -bench=. -trace trace.out $ go tool trace trace.out
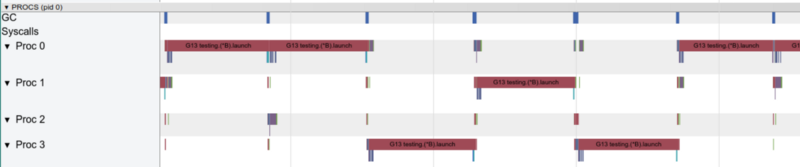
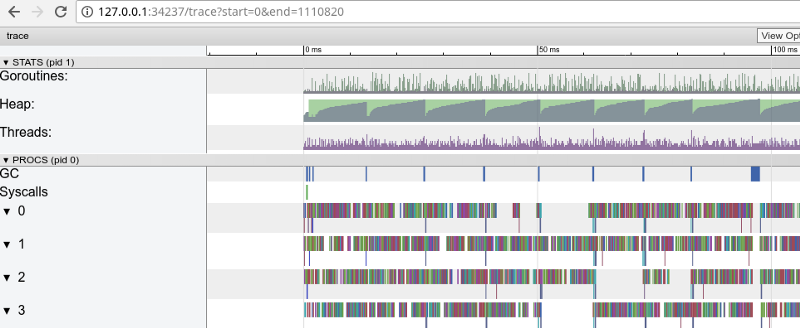 Rainbow tracing: a lot of small tasks (click to open, works only in Google Chrome)
The tracing confirms that all processor cores are occupied (the lines at the bottom 0, 1, etc.), and, at first glance, this is good. But it also shows thousands of small color “calculations” and a few empty areas where the cores were idle. Let's zoom in:
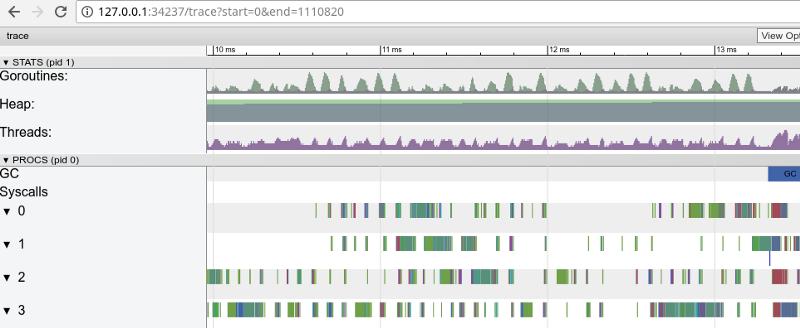 Window in 3 ms (click to open, works only in Google Chrome)
Each core is idle for quite a long time, and also “jumps” all the time between microstrokes. It seems that the granularity of these tasks is not very optimal, which leads to a large number of
context switches and to competition due to synchronization.
Let's see what the
flight detector will tell us. Are there any problems in synchronous access to data (if there are, then we have much bigger problems than performance)?
$ go test -race PASS
Fine! Everything is correct. No data flights were found. The functions for testing and benchmarking functions are different functions (
see the documentation ), but here they call the same
ParseAdexpMessage function, so what we tested for data flights by tests is ok.
The competitive model in the “good” version consists of processing each line from the incoming file in a separate gorutin (to use all the cores). The author's intuition worked well here, since Gorutin has a reputation for light and cheap functions. But how much do we benefit from parallel execution? Let's compare it with the same code, but not using gorutins (just remove the word go, which is before the function call):

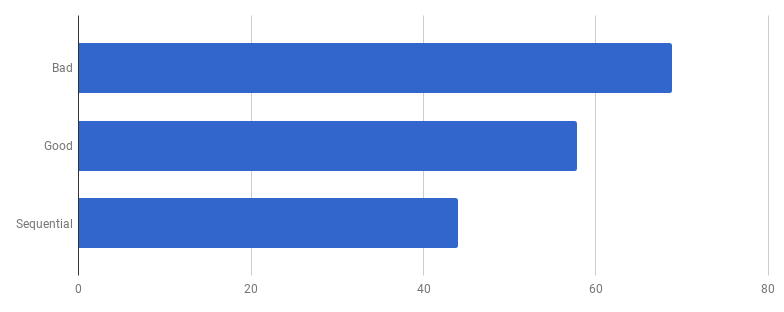
Oops, the code seems to be faster without the use of concurrency. This means that the (non-zero) overhead on launching gorutin exceeds the time that we won by using several cores at the same time. The natural next step is to remove the (non-zero) overhead to use the channels to send the results. Let's replace it with a regular slice:
 μs to challenge (less is better)
We got about 40% acceleration compared to the “good” version, simplifying the code and removing the competitiveness (
diff ).
 Only one core works on one gorutina at a time
Let's now look at the hot functions on the pprof-chart:
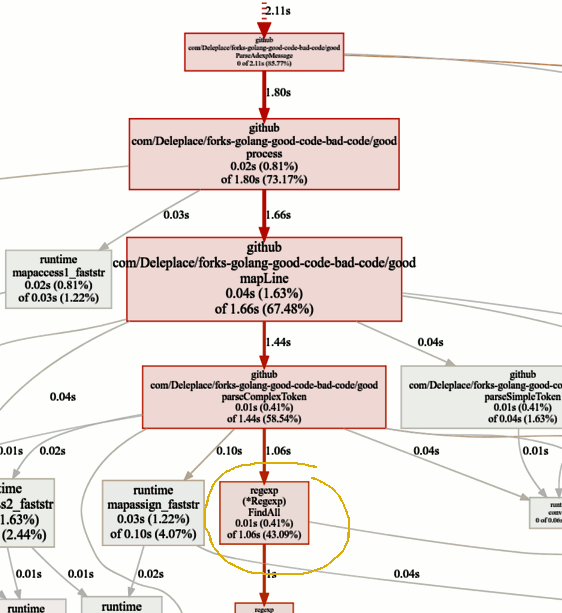 We are looking for bottlenecks
The current version of the benchmark (sequential work, slices) spends 86% of the time parsing messages, and this is normal. But we quickly notice that 43% of the time is spent on using regular expressions and the
(* Regexp) .FindAll function .
Despite the fact that regular expressions are a convenient and flexible way to get data from plain text, they have shortcomings, including the use of a large amount of resources and a processor and memory. They are a powerful tool, but often their use is unnecessary.
In our program template
patternSubfield = "-.[^-]*"
mainly intended for highlighting commands beginning with a dash (-), and there may be several of them in the string. You can do this by dragging a little code using
bytes.Split . Let's adapt the code (
commit ,
commit ) to change regular expressions to Split:
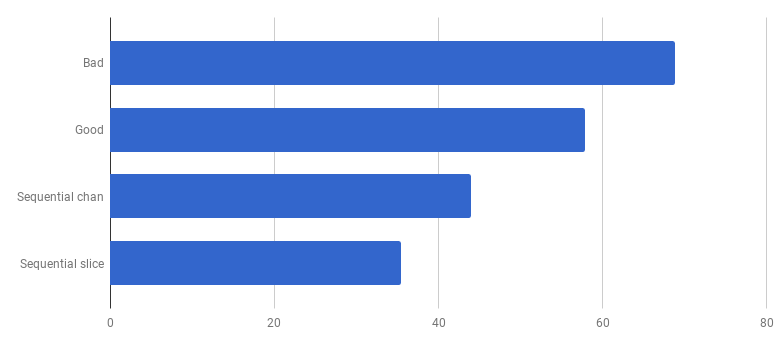
 μs to challenge (less
 is
better)Wow Another 40% more efficient code! The CPU consumption graph now looks like this:
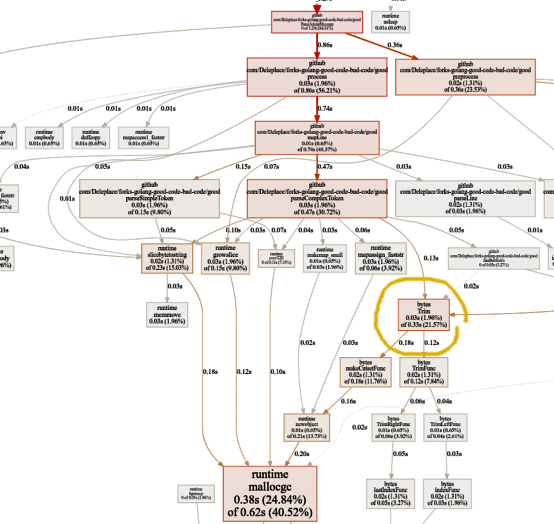
No more time consuming regular expressions. A significant part of it (40%) goes to allocating memory of five different functions. Interestingly, now 21% of the time is spent on the
bytes.Trim function:
 This feature intrigues me. What can we do here?
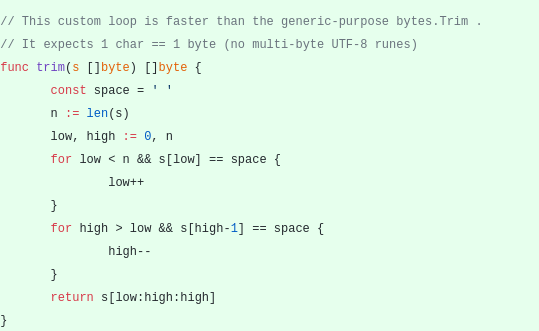
bytes.Trim expects a string with characters that it "cuts off" as an argument, but as this string we pass a string with only one character - a space. This is just an example of how you can get acceleration due to complexity: create your trim function instead of the standard one. Our custom
trim function will work with one byte instead of the whole string:
 μs to challenge (less is better)
Hooray, another 20% cut off! The current version is four times faster than the original “bad” one and at the same time uses only one core. Not bad!
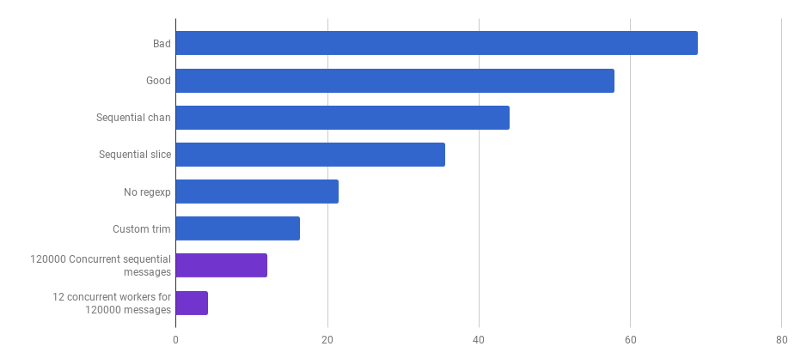
Previously, we abandoned competition at the line processing level, but I argue that acceleration can be obtained by using competition at a higher level. For example, processing 6000 files (6000 messages) is faster on my computer if each file is processed in its own gorutina:
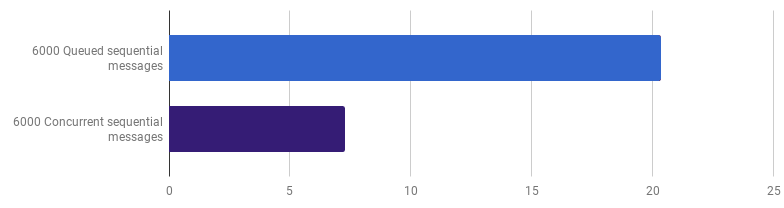 μs to challenge (less is better; purple is a competitive solution)
The gain is 66% (that is, the acceleration is three times). This is good, but not very much, considering that all 12 processor cores are used, which I have. This may mean that the new optimized code that processes the whole file is still a “small task” for which the gorutina overhead and synchronization costs are not insignificant. Interestingly enough, an increase in the number of messages from 6000 to 120 000 does not have any effect on the single-threaded version and decreases the performance on the “one gorutin per message” version. This happens because, despite the fact that creating such a large number of gorutin is possible and sometimes useful, it introduces its own overhead in the runtime-
sheduler area .
We can still shorten the execution time (not 12 times, but still) by creating only a few workers. For example, 12 long-lived gorutin, each of which will process part of the messages:
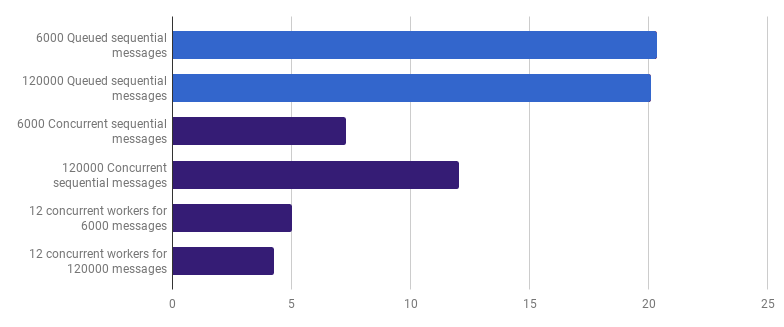 μs to challenge (less is better; purple is a competitive solution)
This option reduces the execution time by 79% compared to the single-threaded version. Note that this strategy makes sense only if you have a lot of files to process.
The optimal use of all processor cores is to use several gorutin, each of which processes a significant amount of data without any interaction or synchronization before the work is completed.
Usually take as many processes (gorutin), how many cores from the processor, but this is not always the best option: it all depends on the specific task. For example, if you read something from the file system or make a lot of network calls, then you should use more gorutin than your cores to get better performance.
 μs to challenge (less is better; purple is a competitive solution)
We have come to the moment when the parsing performance is difficult to increase with some localized changes. Runtime is dominated by time for memory allocation and garbage collection. This sounds logical, as the memory management functions are rather slow. Further optimization of the processes associated with allocations remains as a home task for readers.
Using other algorithms can also lead to a big performance gain.
Here I was inspired by the report of the Lexical Scanning in Go by Rob Pike,
to create a custom lexer (
source ) and a custom parser (
source ). This is not yet ready code (I do not process a bunch of corner cases), it is less comprehensible than the original algorithm, and sometimes it is difficult to write correct error handling. But it is small and 30% faster than the most optimized version.
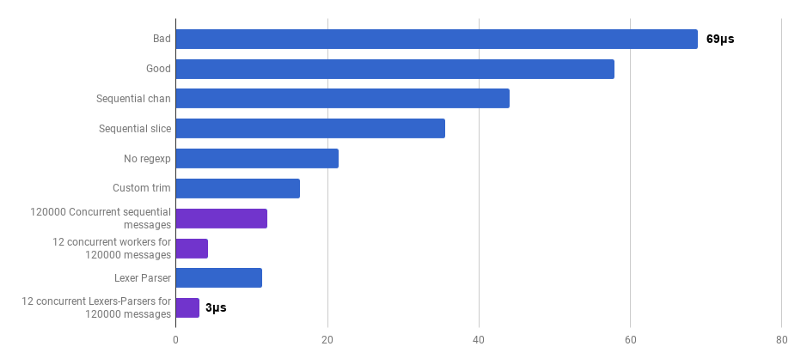 μs to challenge (less is better; purple is a competitive solution)
Yes. As a result, we received an acceleration of 23 times compared with the source code.
That's all for today. I hope you enjoyed this adventure. Here are a few comments and conclusions:
- Productivity can be improved at various levels of abstraction using different techniques, and the gain often increases.
- You need to start tyunit with high-level abstractions: data structures, algorithms, correct decoupling of modules. Try low-level abstractions later: I / O, batching, concurrency, using the standard library, working with memory, memory allocation.
- Big O- analysis is very important, but usually not the most suitable tool to speed up the program.
- Writing benchmarks is hard work. Use profiling and benchmarks to find bottlenecks and gain a broader understanding of what is happening in the program. Keep in mind that benchmark results are not the same as your users will experience in real work.
- Fortunately, the toolkit ( Bench , pprof , trace , Race Detector , Cover ) makes the code performance study accessible and interesting.
- Writing good, relevant tests is not a trivial task. But they are damn important not to go into the wilds. You will be able to refactor, being sure that the code remains correct.
- Stop and ask yourself how fast it is “fast enough”. Do not waste your time on the optimization of a one-time script. Do not forget that optimization is not given in vain: the engineer’s time, complexity, bugs and technical debt.
- Think twice before complicating the code.
- Algorithms with complexity Ω (n²) and higher are usually too expensive.
- Algorithms with complexity O (n) or O (n log n) and below are usually ok.
- Various hidden factors can not be ignored. For example, all the improvements in the article were made by reducing these factors, and not by changing the complexity class of the algorithm.
- I / O is often a bottleneck: network requests, database requests, file system.
- Regular expressions are often too expensive and unnecessary solutions.
- Memory allocations are more expensive than computations.
- An object allocated on the stack is cheaper than an object allocated on the heap.
- Slices are useful as an alternative to expensive memory movement.
- Strings are effective when used only for reading (including re-scaling). In all other cases, [] byte is more efficient.
- It is very important that the data you are processing are nearby (processor caches).
- Competitiveness and parallelism are very useful, but they are difficult to prepare.
- When you dig deep and low, remember the “glass floor” that you don't want to smash into Go. If your hands are itching to try assembly instructions, SIMD instructions, you may need to use Go only for prototyping, and then move to a lower level language to get full control of the hardware and each nanosecond!