
In March, a team of our developers with the proud name “Hands-Auki” vigilantly fought for two days on the digital fields of the AI.HACK hackathon. In total, five tasks from different companies were proposed. We focused on the task of Gazpromneft: forecasting the demand for fuel from B2B clients. It was necessary for the impersonal data - the region of purchase of fuel, the number of refueling, the type of fuel, price, date and ID-client - to learn to predict how much this or that client will buy in the future. Looking ahead - our team solved this problem with the highest accuracy. Clients were divided into three segments: large, medium and small. And besides the main task, we also built a forecast of total consumption for each of the segments.
Unloading contained data on customer purchases for the period from November 2016 to March 15, 2018 (for the period from January 1, 2018 to March 15, 2018 data did NOT include volumes).
Sample data:

The names of the columns speak for themselves, I think it makes no sense to explain.
In addition to the training sample, the organizers provided a test sample for the three months of this year. Prices are indicated for corporate clients, taking into account specific discounts, which depend on the consumption of a particular client, on special offers and other points.
Having received the initial data, we, like everyone, began to try classical methods of machine learning, trying to build a suitable model, to find the correlation of some signs. We tried to extract additional features, built regression models (XGBoost, CatBoost, etc.).
The statement of the problem itself initially implied that the price of fuel somehow affects the demand, and it is necessary to understand this dependence more precisely. But when we began to analyze the data provided, we saw that the demand does not correlate with the price.
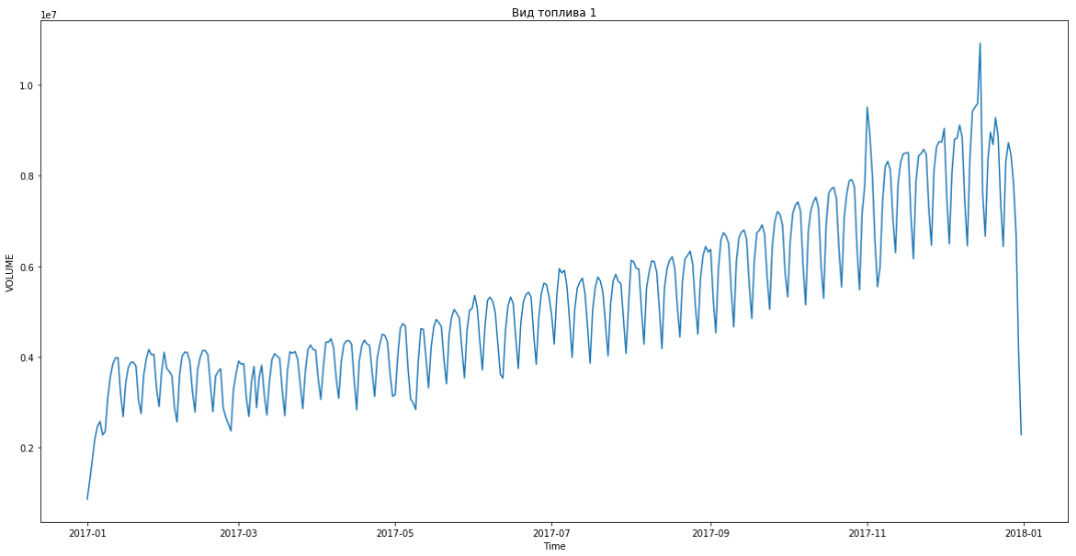

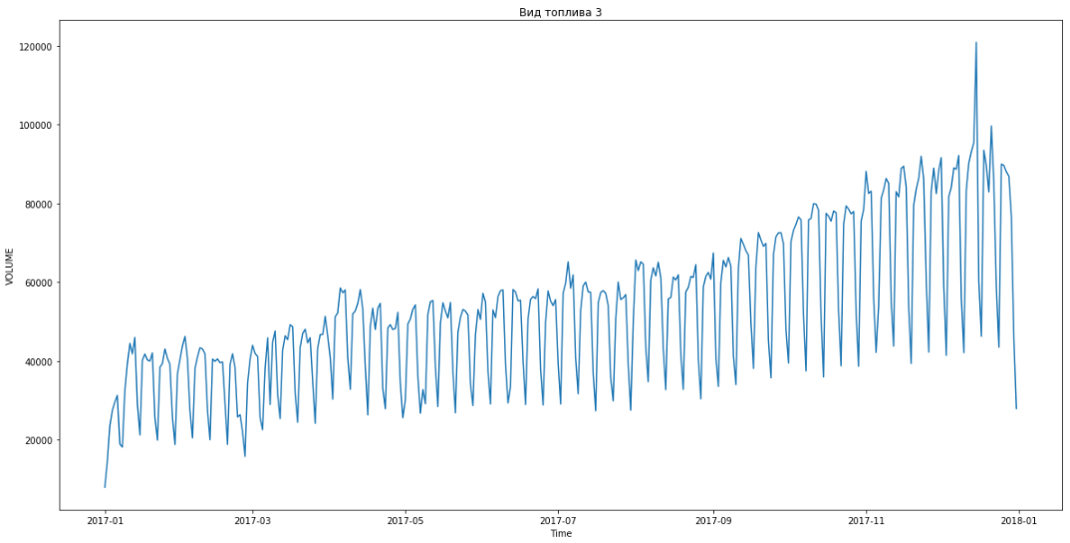
Sign correlation:

It turned out that the number of liters practically does not depend on the price. This was explained quite logically. The driver is driving on the highway, he needs to refuel. He has a choice: either he will refuel at a gas station, with which the company cooperates, or on some other. But the driver does not care how much fuel costs - the organization pays for it. Therefore, he simply turns to the nearest gas station and fills the tank.
However, despite all the efforts and the tried and tested models, the minimum permissible prediction accuracy (baseline), which was calculated using this formula (Symmetric mean absolute percentage percentage), could not be achieved:
Tried all the options, nothing worked. And then it occurred to one of us to spit on machine learning and turn to the good old statistics: just take the average value by type of fuel, validate and see what the accuracy is.
So for the first time we exceeded the threshold value.
Began to think how to improve the result. Tried to take the median values for customer groups, types of fuel, regions, gas station numbers. The problem was that in the test data about 30% of the client IDs that were in the training sample were missing. That is, new clients appeared in the test. This was a mistake of the organizers, not verified. But we had to solve the problem ourselves. We did not know the consumption of new customers, and therefore could not make forecasts for them. And here machine learning helped.
At the first stage, the missing data was filled with the average or median value for the entire sample. Then an idea emerged: why not create new customer profiles based on the available data? We have cuts by region, how many customers there buy fuel, with what frequency, what types. Clustered existing customers, made characteristic profiles for different regions and trained XGBoost on them, which then “completed” the profiles of new customers.
This allowed us to break out in first place. There were still three hours before the debriefing. We were delighted and began to solve the bonus problem - forecasting by segments for three months in advance.
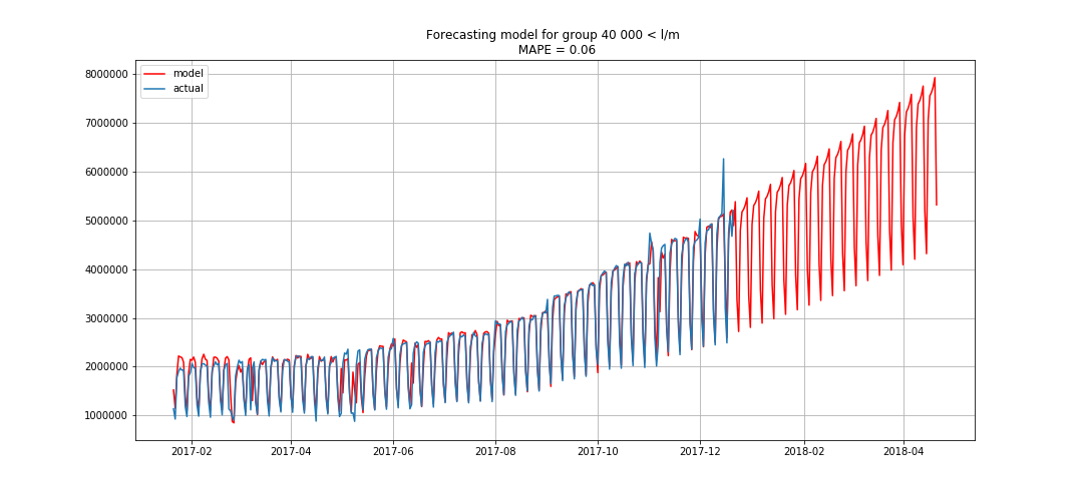
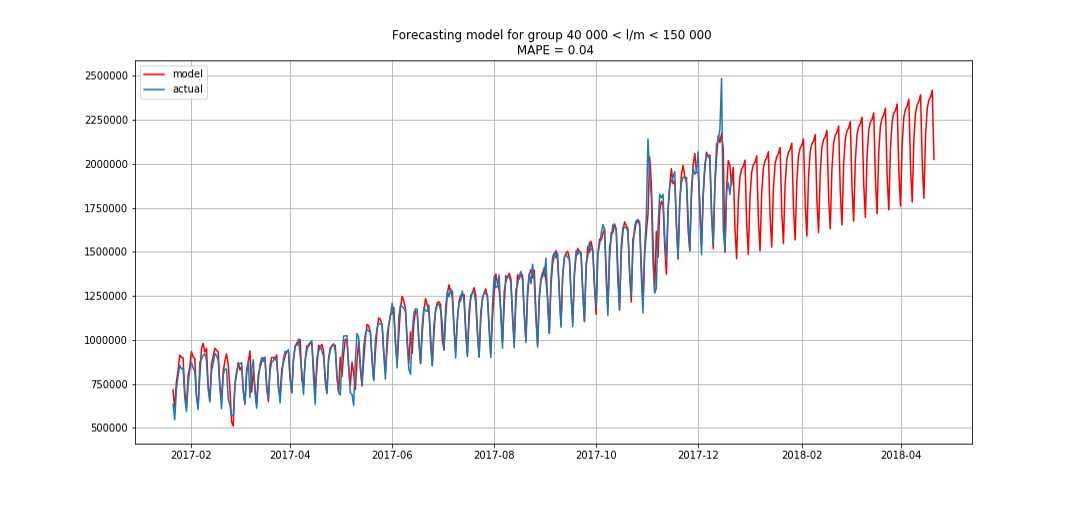
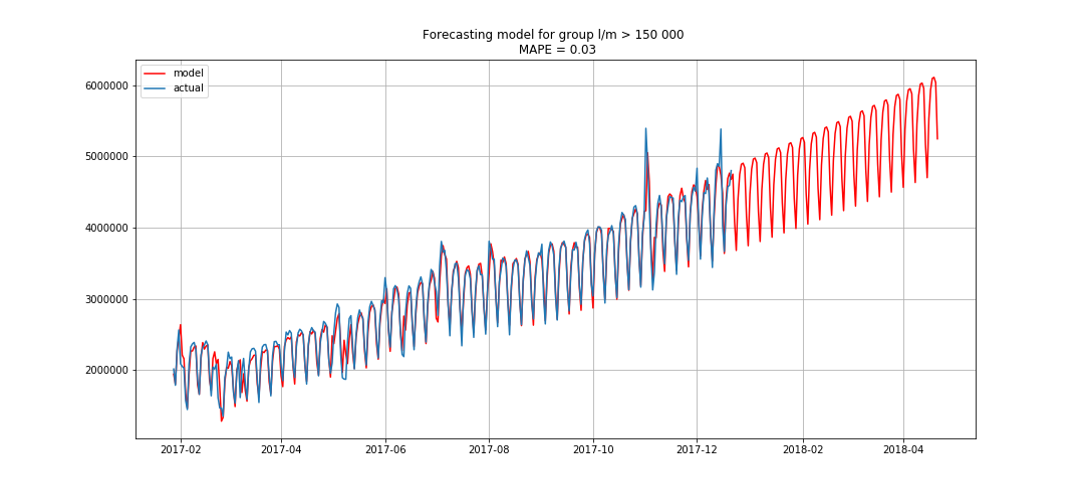
The blue shows the real data, red - the forecast. The error ranged from 3% to 6%. It was possible to calculate more precisely, for example, taking into account seasonal peaks and holidays.
While we were doing this, one team began to catch up with us, improving its results every 15–20 minutes. We also began to fuss and decided to do something in case they catch up with us.
We started to make in parallel another model that ranked statistics by degree of importance, its accuracy was slightly lower than the first. And when our competitors went around, we tried to combine both models. This gave us a small increase in the metric - up to 37.24671%, as a result, we regained the first place and kept it to the end.
For the victory, our team "Hands-Auki" received a certificate for 100 thousand rubles, honor, respect and ... full of self-esteem went to save! ;)
Jet Infosystems Development Team