There are various techniques and tricks that help optimize the performance of iOS applications, when one task must be completed in 16.67 milliseconds. We tell how to unload main thread and which tools are better suited for tracking the call stack in it.
“Guys, let's imagine that you can reduce the launch time by 10 seconds. Multiplying this by 5 million users, we will have 50 million seconds every day. In a year it will be about ten human lives. Therefore, if you make the initial load 10 seconds faster, you will save several dozen lives. It's really worth it, isn't it? ”
Steve Jobs about performance (Apple II computer startup time).
The article is based on a report by iOS-developer from Fyusion Luke Parham, with whom he spoke at the International Conference of Mobile Developers MBLT DEV last year.
MBLT DEV 2018 will be held in Moscow on September 28. Tickets are the cheapest now. Traditionally, while the Program Committee selects reports, you can buy early bird konfu tickets. Take advantage of this opportunity now. From June 29, tickets will be worth more.
Frame loss
The main thread executes code that is responsible for touch type events and UI operation. He renders the screen. In most modern smartphones, rendering occurs at 60 frames per second. This means that tasks must be completed in 16.67 milliseconds (1000 milliseconds / 60 frames). Therefore, the acceleration of work in the Main Thread is important.
If an operation takes more than 16.67 milliseconds, frames are automatically lost, and application users will notice this when playing animations. On some devices, rendering is even faster, for example, on iPad Pro 2017, the screen refresh rate is 120 Hz, so there are only 8 milliseconds to perform operations per frame.
Rule # 1
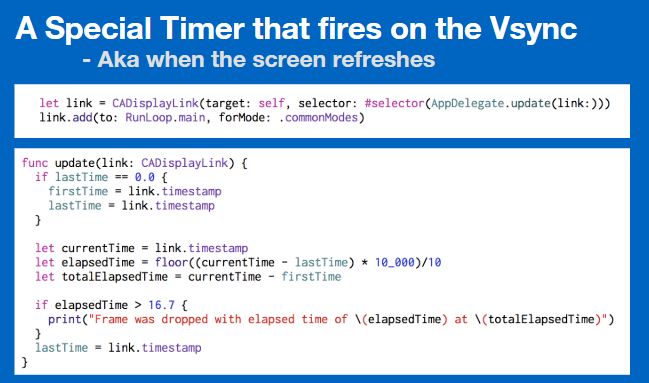
CADisplayLink is a special timer that starts during vertical synchronization (Vsync). Vertical sync ensures that no more than 16.67 milliseconds is allocated for rendering a frame. As a check in AppDelegate, you can register CADisplayLink in the main run loop, and then you will have an additional function that will perform the calculations. You can track the duration of the application and find out how much time has passed since the last launch of this function.
 .
.
The launch occurs when the need arises in the render. If there were many different operations that overloaded the main thread, this function starts with a delay of 100 milliseconds. This means that too much work was done, and at this point there was a loss of personnel.
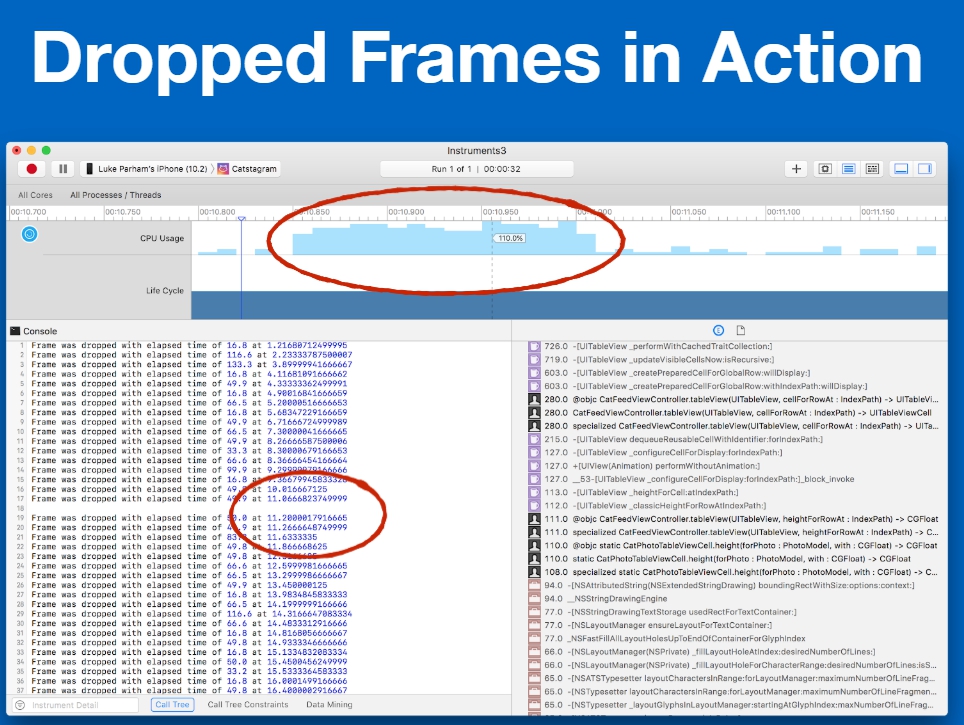
Before you Catstagram application. While the pictures are loading, the application starts to slow down. We see that the frame rate has decreased at a certain point, and the load time lasted about 200 milliseconds. It seems like something takes too much time.
 .
.
Users will not be delighted with this, especially if the application runs on older devices, such as iPhone 5 or older iPods, etc.
Time profiler
A useful tool for tracking such problems is Time Profiler. Other tools are also useful, but in the end, at Fyusion, we use Time Profiler 90% of the time. Typically, problems in the application are associated with ScrollView, areas with text and images.
Images are important. We decode the JPEG format with a UIImage . They do it slowly, and we cannot track their performance directly. This does not happen immediately after the image is UIImageView in the UIImageView , but you can see this moment through the trace in Time Profiler.
Text formatting is another important point. It matters when the application has a large number of "complex" text, for example in Japanese or Chinese. It may take a long time to calculate the correct dimensions for the lines with text.
Interface markup also slows down rendering in the application. This is especially true for the AutoLayout tool. AutoLayout is easy to use, but it slows down the application greatly compared to manual layout. We have to make concessions. If AutoLayout slows down the application, it may be time to abandon it and try other types of markup.
Sample trace
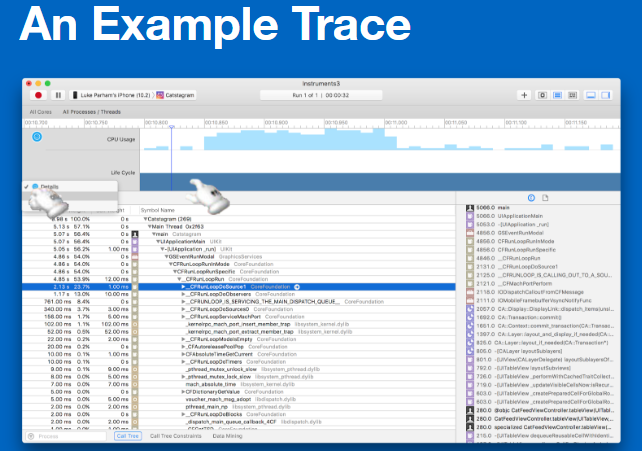
In this example call tree, you can see what work the CPU is doing. You can change the type of tracing, look at it in terms of threads, processors. Usually the most interesting is dividing tracing into threads and observing the main stream.
Initial trace analysis may seem complicated. It does not always work out right away what FRunLoopDoSource0 means.
Having rummaged in tracing, it is possible to understand how the system is arranged, and then everything makes sense. You can track the stack trace and look at all the system elements that you did not write. But at the very bottom is your source code.
Call tree
Suppose we have a very simple application. It contains the main function, which calls several other functions. The essence of Time Profiler work is that it takes snapshots of the current stack trace status every one millisecond (by default). After another millisecond, he takes a snapshot of the trace. It calls the main function, which calls the function “ foo ”, which calls the function “ bar ”. The primary stack trace is shown in the screenshot below. This data is collected together. Opposite each function the number is indicated: 1, 1, 1.
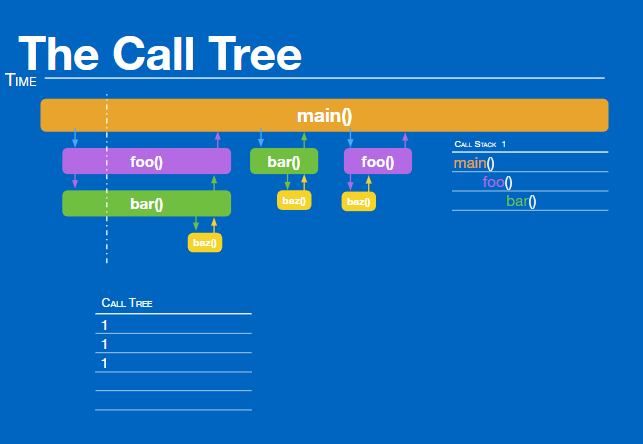
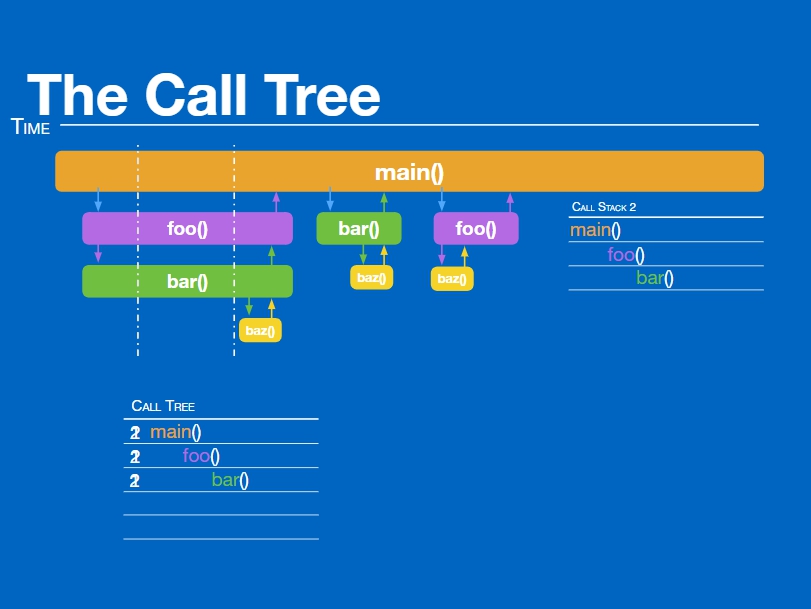
This means that each of these functions was called once. Then, after one millisecond, we get another shot of the stack. This time it looks exactly the same, so all the numbers increase by 1, and we get 2, 2, 2.
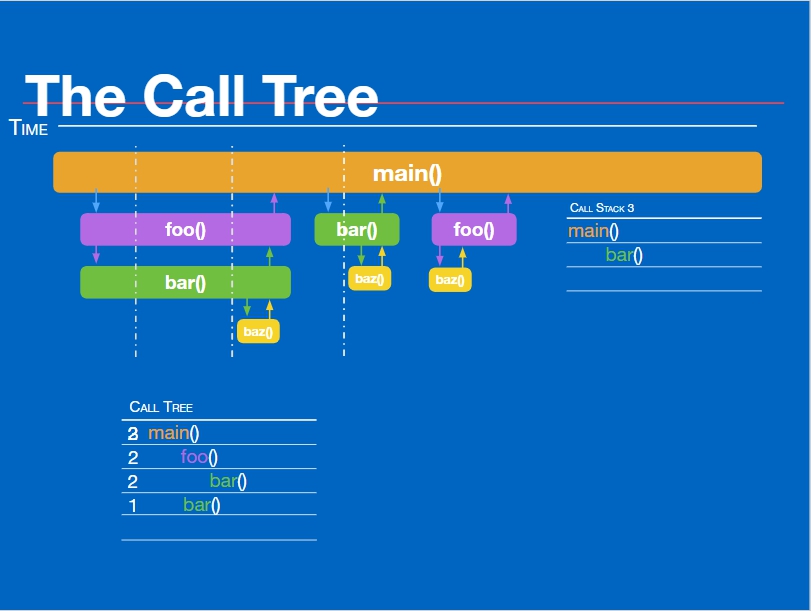
During the third millisecond, our call stack looks a little different. The main function calls bar directly. Therefore, one more is added to the main function and the “ bar ” function, and their value becomes 3. Then the separation takes place. Sometimes the main function directly calls “ foo ”, sometimes “ bar ” is called directly. This happened once. One function was called through another.
Further, one function called another, which called the third function. We see that the “ baz ” function was called twice. But this function is so insignificant that it is called faster than one millisecond.
When using Time Profiler, it is important to remember that it does not show specific time intervals. It does not display the exact time of the execution of a particular function. It only reports how often it appears in the images, which gives only an approximate value of the duration of each function. Since some processes occur fairly quickly, they never appear in the pictures.
When you switch calls to the console mode, you can see and compare all the moments of reducing the frame rate. In the example, several frames were lost and various processes were performed.
If you press alt-click on macOS, this will expand the section and nested sections, and not just the selected one. They will be ordered by the amount of work done. In 90% of cases, CFRunLoopRun will be in the first place, and after that - callback functions.
This application is entirely based on a single run loop execution task loop. There is an infinitely repeating loop, and on each of its iterations, callbacks are started. If you look at these callbacks, you can select top bottlenecks.
Looking at these challenges in more detail, you most likely do not understand what they are doing. These can be renders, image provider, IO.
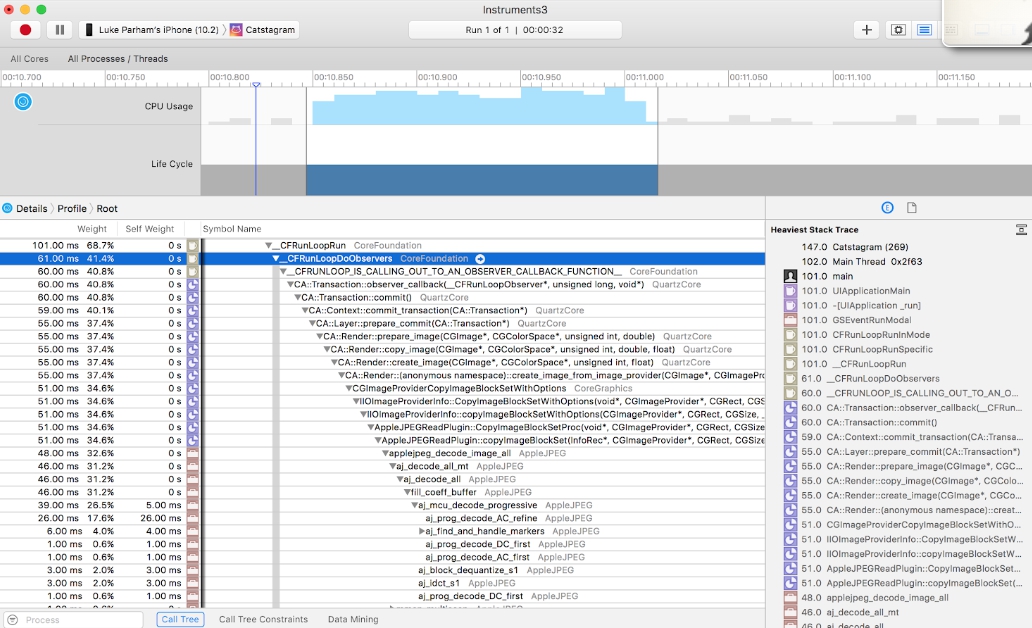
There is an option that allows you to hide system libraries. They are actually the problem areas of the application.
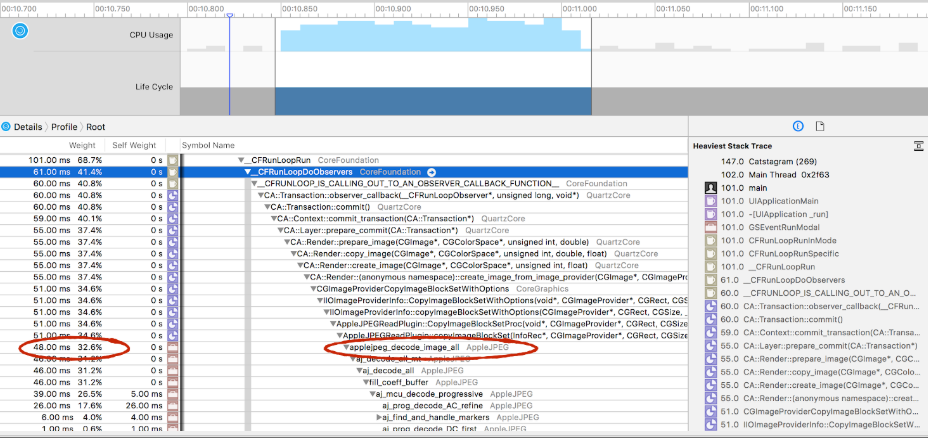
There are gauges that, as a percentage, show how much work a particular function or operation performs. If we look at this example, we will see here the value - 34%. This is an Apple jpeg_decode_image_all process. After studying it becomes clear that decoding JPEG images occurs in main thread, and in most cases this is the cause of frame loss.
Rule # 2
In general, decoding jpeg-images should be done in the background. Most third-party libraries (AsyncDisplayKit, SDWebImage, etc.) can do this by default. If you do not want to use frameworks, you can do the decoding manually. To do this, you can write an extension over a UIImage in which to create a context and manually draw the image.
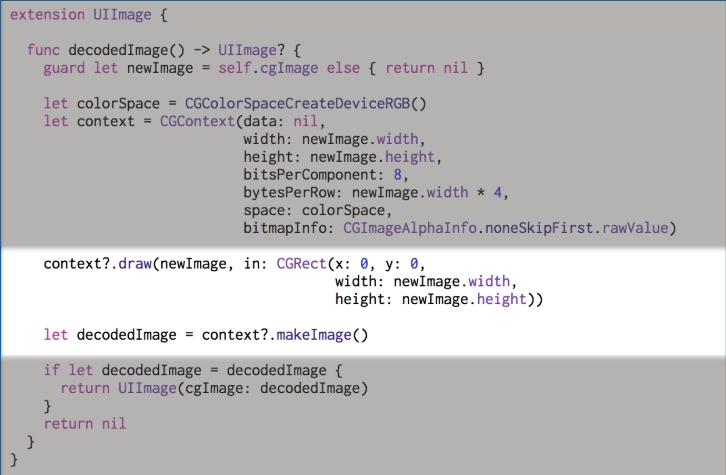
When performing this operation, you can call the decodeImage function decodeImage non-main thread. It will always return a decoded image. There is no way to check if a particular UIImage image has been decoded, so you always have to pass them through this method. But if you are caching data in the right way, there will be no unnecessary processes in the system.
From a technical point of view, it is less effective. The application of the UIImageView class UIImageView be optimized and efficient. But he also performs hardware decoding, so there are also disadvantages here. With this method, your images will be decoded more slowly. But there is good news - you can decode the image in the manner described above not on main thread, and then return to main thread and adjust the interface.
Despite the fact that this operation takes more time, it can be done not on main thread, and therefore does not interfere with the user's activity in the application, as it does not slow down the scrolling of the tape. Profitable solution.
Out of memory warnings
With any signal of low memory, I want to delete all the unused data that is possible. But if various processes are performed on third-party streams, then the placement of bulk decoded JPEG images on them will take up most of the free space.
This problem occurred in the Fyuse application. If I decoded all my JPEG images on a third-party stream, in some cases, for example, on older phone models, this system would instantly break the application. This would happen because third-party task streams do not respond to a warning about the lack of memory from the system, such as "Hey, delete unnecessary data!". The following situation occurs: first you place all these images on third-party streams, and then the application constantly fails. If third-party threads send signals to the main thread about what is happening in the system, then this problem will not arise.
Work without fail
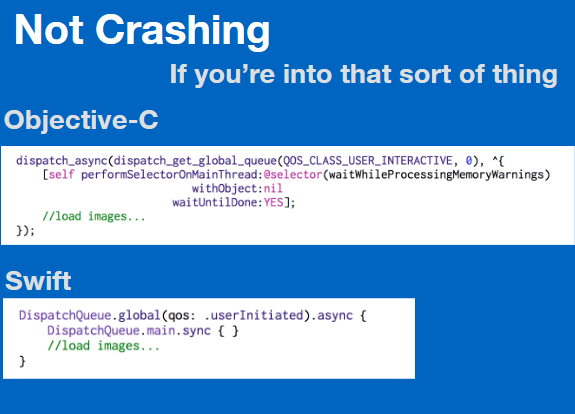
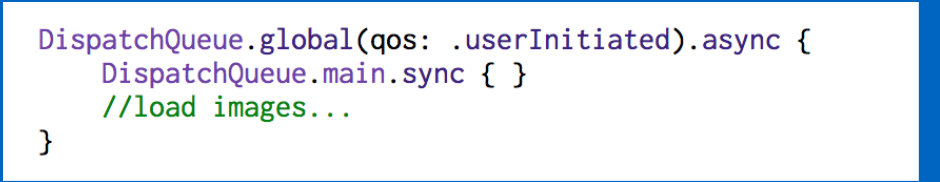
In essence, main thread is a queue consisting of processes. When working with third-party threads, you can write the performSelectorOnMainThread:withObject:waitUntilDone: command in Objective-C. Thanks to her, the tasks will rise at the end of the queue at main thread. Therefore, if the main thread is busy processing notifications of low memory, a call to this command will allow to wait until all notifications are processed, and only then start the execution of a complex process of loading and placing data. In Swift, this looks somewhat simpler. DispatchQueue.main.sync frees up space on main thread.
Here is another example. We have freed the memory and are decoding images on third-party streams. Visually scrolling tape was much better. We still have a frame loss due to the fact that we are testing the iPod 5g. This is one of the worst test models of those that still support iOS 10 and 11.

If you experience a similar frame loss, the tape can still be viewed. However, there are processes that continue to create a loss of frames. There are other ways to make an application run faster.
Of course, it is not always easy to optimize the operation of the application. But if you have tasks that are performed for a relatively long time, you should put them into background threads. Make sure that these tasks are not related to the UI, since many of the UIKit classes are not thread-safe, that is, you cannot create them in the backgroup.
Use Core Graphics if you need to process images on a third-party stream. Do not hide the display of system libraries. Keep in mind the low-memory warnings.
Welcome to MBLT DEV 2018
Come September 28 to the 5th International Conference of Mobile Developers MBLT DEV 2018 in Moscow. The first speakers are already on the site, and the latest early bird is still on sale. The price of tickets will rise on June 29th. Buy tickets now at the lowest price.

Read about the implementation of the user interface in iOS, the application of Bezier curves and other useful tools in the second part of the article, which we will publish on June 28.