D3.js is a JavaScript library for manipulating documents based on input data. Angular is a framework that boasts high performance data binding.
Below I will consider one good approach to using all this power. From D3 simulations to SVG injections and the use of template syntax.
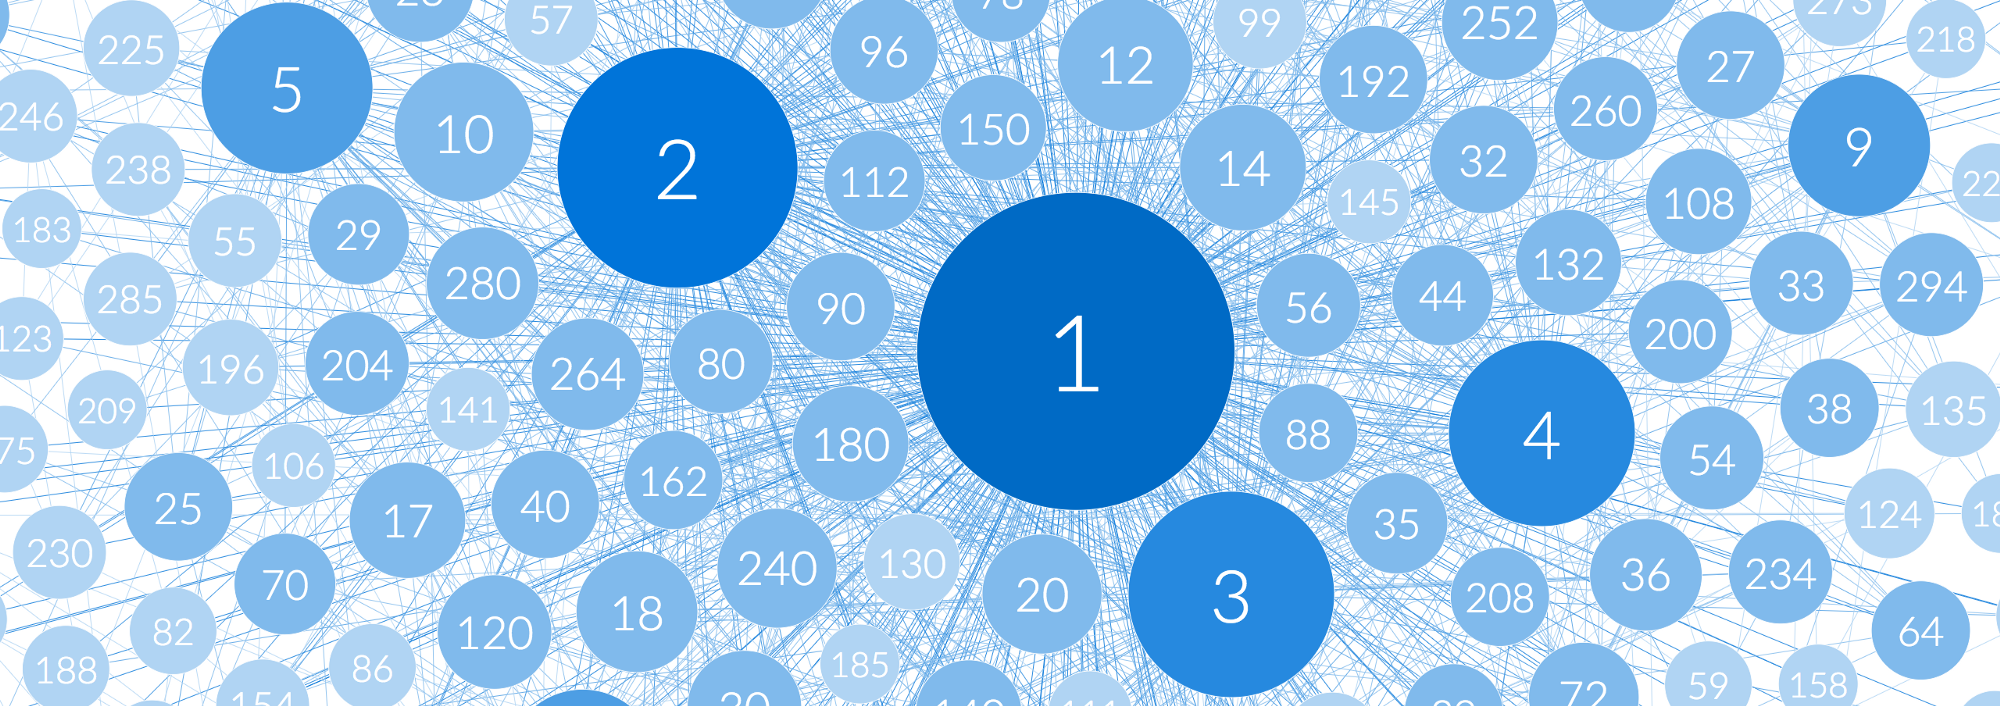 Demo: positive numbers up to 300 connected with their dividers.
For coolers that will not read this article, the link to the repository with the example code is below. For all other middles (of course, this is not you), the code in this article is simplified for readability.
Source Code (recently updated to Angular 5)
DemoHow to easily make such cool nishtyaki
Below I will present one approach to using Angular + D3. We will go through the following steps:
- Project Initialization
- Creating angular d3 interfaces
- Simulation generation
- Binding simulation data to the document via angular
- Binding user interaction to the graph
- Performance optimization through change detection mechanism
- Publishing and nagging about angular versioning strategies
So, open your terminal, run the code editors and do not forget to inflame the clipboard, we begin to dive into the code.
Application structure
We will separate the code associated with d3 and svg. I will describe everything in more detail when the necessary files are created, but for now, here is the structure of our future application:
d3 |- models |- directives |- d3.service.ts visuals |- graph |- shared
Initializing Angular Applications
Run the Angular application project. Angular 5, 4 or 2 our code has been tested on all three versions.
If you don't have angular-cli yet, install it quickly.
npm install -g @angular/cli
Then generate a new project:
ng new angular-d3-example
Your application will be created in the
angular-d3-example folder. Run the
ng serve command from the root of this directory, the application will be available at
localhost:4200 .
D3 Initialization
Do not forget to install his TypeSctipt ad.
npm install --save d3 npm install --save-dev @types/d3
Creating angular d3 interfaces
For correct use of d3 (or any other libraries) inside the framework, it is best to interact through the custom interface, which we will define using classes, angular services and directives. By doing so, we will separate the main functionality from the components that will use it. This will make our application structure more flexible and scalable, and isolates bugs.
Our D3 folder will have the following structure:
d3 |- models |- directives |- d3.service.ts
models will provide type safety and will provide datum objects.
directives will tell the elements how to use the d3 functionality.
d3.service.ts will provide all the methods for using d3 models, directives, as well as external components of the application.
This service will contain computational models and behaviors. The
getForceDirectedGraph method will return an instance of a directed graph. The
applyZoomableBehaviour and
applyDraggableBehaviour allow you to associate user interaction with the corresponding behaviors.
// path : d3/d3.service.ts import { Injectable } from '@angular/core'; import * as d3 from 'd3'; @Injectable() export class D3Service { constructor() {} applyZoomableBehaviour() {} applyDraggableBehaviour() {} getForceDirectedGraph() {} }
Force Directed Graph
We proceed to the creation of a class of oriented graph and related models. Our graph consists of nodes (nodes) and arcs (links), let's define the corresponding models.
// path : d3/models/index.ts export * from './node'; export * from './link'; // To be implemented in the next gist export * from './force-directed-graph';
// path : d3/models/link.ts import { Node } from './'; // Implementing SimulationLinkDatum interface into our custom Link class export class Link implements d3.SimulationLinkDatum<Node> { // Optional - defining optional implementation properties - required for relevant typing assistance index?: number; // Must - defining enforced implementation properties source: Node | string | number; target: Node | string | number; constructor(source, target) { this.source = source; this.target = target; } }
// path : d3/models/node.ts // Implementing SimulationNodeDatum interface into our custom Node class export class Node extends d3.SimulationNodeDatum { // Optional - defining optional implementation properties - required for relevant typing assistance index?: number; x?: number; y?: number; vx?: number; vy?: number; fx?: number | null; fy?: number | null; id: string; constructor(id) { this.id = id; } }
After the main models are declared by the graph manipulation, let's declare the model of the graph itself.
// path : d3/models/force-directed-graph.ts import { EventEmitter } from '@angular/core'; import { Link } from './link'; import { Node } from './node'; import * as d3 from 'd3'; const FORCES = { LINKS: 1 / 50, COLLISION: 1, CHARGE: -1 } export class ForceDirectedGraph { public ticker: EventEmitter<d3.Simulation<Node, Link>> = new EventEmitter(); public simulation: d3.Simulation<any, any>; public nodes: Node[] = []; public links: Link[] = []; constructor(nodes, links, options: { width, height }) { this.nodes = nodes; this.links = links; this.initSimulation(options); } initNodes() { if (!this.simulation) { throw new Error('simulation was not initialized yet'); } this.simulation.nodes(this.nodes); } initLinks() { if (!this.simulation) { throw new Error('simulation was not initialized yet'); } // Initializing the links force simulation this.simulation.force('links', d3.forceLink(this.links) .strength(FORCES.LINKS) ); } initSimulation(options) { if (!options || !options.width || !options.height) { throw new Error('missing options when initializing simulation'); } if (!this.simulation) { const ticker = this.ticker; // Creating the force simulation and defining the charges this.simulation = d3.forceSimulation() .force("charge", d3.forceManyBody() .strength(FORCES.CHARGE) ); // Connecting the d3 ticker to an angular event emitter this.simulation.on('tick', function () { ticker.emit(this); }); this.initNodes(); this.initLinks(); } this.simulation.force("centers", d3.forceCenter(options.width / 2, options.height / 2)); this.simulation.restart(); } }
Since we have defined our models, let's also update the
getForceDirectedGraph method in
D3Service getForceDirectedGraph(nodes: Node[], links: Link[], options: { width, height} ) { let graph = new ForceDirectedGraph(nodes, links, options); return graph; }
Creating an instance of
ForceDirectedGraph will return the following object
ForceDirectedGraph { ticker: EventEmitter, simulation: Object }
This object contains the
simulation property with the data passed to us, as well as the
ticker property containing the event emitter, which is triggered at each simulation tick. Here is how we will use it:
graph.ticker.subscribe((simulation) => {});
We will define the rest of the
D3Service class later, but for now let's try to bind the data of the
simulation object to the document.
Simulation bind
We have an instance of the ForceDirectedGraph object, it contains constantly updated data of vertices (node) and arcs (link). You can bind this data to a document, in a d3's way (like a savage):
function ticked() { node .attr("cx", function(d) { return dx; }) .attr("cy", function(d) { return dy; }); }<source> , 21 , , . Angular . <h3><i>: SVG Angular</i></h3> <h3>SVG Angular</h3> SVG, svg html . Angular SVG Angular ( <code>svg</code>). SVG : <ol> <li> <code>svg</code>.</li> <li> “svg”, Angular', <code><svg:line></code></li> </ol> <source lang="xml"> <svg> <line x1="0" y1="0" x2="100" y2="100"></line> </svg>
app.component.html
<svg:line x1="0" y1="0" x2="100" y2="100"></svg:line>
link-example.component.html
SVG components in Angular
Assigning selectors to components that are in the SVG namespace will not work as usual. They can only be applied via the attribute selector.
<svg> <g [lineExample]></g> </svg>
app.component.html
import { Component } from '@angular/core'; @Component({ selector: '[lineExample]', template: `<svg:line x1="0" y1="0" x2="100" y2="100"></svg:line>` }) export class LineExampleComponent { constructor() {} }
link-example.component.ts
Note the svg prefix in the component templateThe end of the interlude
Simulation snapping - visual part
Armed with the ancient knowledge of svg, we can begin to create components that will tamper with our data. Isolating them in the
visuals folder, then we will create a
shared folder (where we will place the components that can be used by other types of graphs) and the main
graph folder, which will contain all the code needed to display the directed graph (Force Directed Graph).
visuals |- graph |- shared
Graph visualization
Create our root component that will generate the graph and bind it to the document. We pass it nodes (nodes) and arcs (links) through the component's input attributes.
<graph [nodes]="nodes" [links]="links"></graph>
The component takes the
nodes and
links properties and creates an instance of the
ForceDirectedGraph class
// path : visuals/graph/graph.component.ts import { Component, Input } from '@angular/core'; import { D3Service, ForceDirectedGraph, Node } from '../../d3'; @Component({ selector: 'graph', template: ` <svg #svg [attr.width]="_options.width" [attr.height]="_options.height"> <g> <g [linkVisual]="link" *ngFor="let link of links"></g> <g [nodeVisual]="node" *ngFor="let node of nodes"></g> </g> </svg> `, styleUrls: ['./graph.component.css'] }) export class GraphComponent { @Input('nodes') nodes; @Input('links') links; graph: ForceDirectedGraph; constructor(private d3Service: D3Service) { } ngOnInit() { this.graph = this.d3Service.getForceDirectedGraph(this.nodes, this.links, this.options); } ngAfterViewInit() { this.graph.initSimulation(this.options); } private _options: { width, height } = { width: 800, height: 600 }; get options() { return this._options = { width: window.innerWidth, height: window.innerHeight }; } }
NodeVisual component
Next, let's add a component to render the node (node), it will display a circle with the id of the node.
// path : visuals/shared/node-visual.component.ts import { Component, Input } from '@angular/core'; import { Node } from '../../../d3'; @Component({ selector: '[nodeVisual]', template: ` <svg:g [attr.transform]="'translate(' + node.x + ',' + node.y + ')'"> <svg:circle cx="0" cy="0" r="50"> </svg:circle> <svg:text> {{node.id}} </svg:text> </svg:g> ` }) export class NodeVisualComponent { @Input('nodeVisual') node: Node; }
LinkVisual component
Here is the component for arc visualization (link):
// path : visuals/shared/link-visual.component.ts import { Component, Input } from '@angular/core'; import { Link } from '../../../d3'; @Component({ selector: '[linkVisual]', template: ` <svg:line [attr.x1]="link.source.x" [attr.y1]="link.source.y" [attr.x2]="link.target.x" [attr.y2]="link.target.y" ></svg:line> ` }) export class LinkVisualComponent { @Input('linkVisual') link: Link; }
Behavior
Let's go back to the d3-part of the application, let's start creating directives and methods for the service, which will give us cool ways to interact with the graph.
Behavior - Zoom
Add bindings for the zoom function, so that later it can be easily used:
<svg #svg> <g [zoomableOf]="svg"></g> </svg>
// path : d3/d3.service.ts // ... export class D3Service { applyZoomableBehaviour(svgElement, containerElement) { let svg, container, zoomed, zoom; svg = d3.select(svgElement); container = d3.select(containerElement); zoomed = () => { const transform = d3.event.transform; container.attr("transform", "translate(" + transform.x + "," + transform.y + ") scale(" + transform.k + ")"); } zoom = d3.zoom().on("zoom", zoomed); svg.call(zoom); } // ... }
// path : d3/directives/zoomable.directive.ts import { Directive, Input, ElementRef } from '@angular/core'; import { D3Service } from '../d3.service'; @Directive({ selector: '[zoomableOf]' }) export class ZoomableDirective { @Input('zoomableOf') zoomableOf: ElementRef; constructor(private d3Service: D3Service, private _element: ElementRef) {} ngOnInit() { this.d3Service.applyZoomableBehaviour(this.zoomableOf, this._element.nativeElement); } }
Behavior — Drag and Drop
To add drag and drop capabilities, we need to have access to the simulation object so that we can pause drawing while dragging.
<svg #svg> <g [zoomableOf]="svg"> <g [nodeVisual]="node" *ngFor="let node of nodes" [draggableNode]="node" [draggableInGraph]="graph"> </g> </g> </svg>
// path : d3/d3.service.ts // ... export class D3Service { applyDraggableBehaviour(element, node: Node, graph: ForceDirectedGraph) { const d3element = d3.select(element); function started() { /** Preventing propagation of dragstart to parent elements */ d3.event.sourceEvent.stopPropagation(); if (!d3.event.active) { graph.simulation.alphaTarget(0.3).restart(); } d3.event.on("drag", dragged).on("end", ended); function dragged() { node.fx = d3.event.x; node.fy = d3.event.y; } function ended() { if (!d3.event.active) { graph.simulation.alphaTarget(0); } node.fx = null; node.fy = null; } } d3element.call(d3.drag() .on("start", started)); } // ... }
// path : d3/directives/draggable.directives.ts import { Directive, Input, ElementRef } from '@angular/core'; import { Node, ForceDirectedGraph } from '../models'; import { D3Service } from '../d3.service'; @Directive({ selector: '[draggableNode]' }) export class DraggableDirective { @Input('draggableNode') draggableNode: Node; @Input('draggableInGraph') draggableInGraph: ForceDirectedGraph; constructor(private d3Service: D3Service, private _element: ElementRef) { } ngOnInit() { this.d3Service.applyDraggableBehaviour(this._element.nativeElement, this.draggableNode, this.draggableInGraph); } }
So, what we have in the end:
- Graph generation and simulation via D3
- Binding simulation data to a document using Angular
- User interaction with the graph through d3
You are probably thinking now: “My simulation data is constantly changing, angular using change detection (change detection) constantly binds this data to a document, but why should I do that, I want to update the graph on my own after each tick of the simulation.”
Well, you are partly right, I compared the results of performance tests with different mechanisms for tracking changes and it turns out that when we apply changes in ticks, we get a good performance boost.
Angular, D3 and Change Detection
Install the change tracking in the onPush method (the changes will be tracked only when the object links are completely replaced).
References to vertex and arc objects do not change, respectively, and changes will not be tracked. It is wonderful! Now we can control the change tracking and mark it to be checked at every simulation tick (using the event emitter ticker that we set).
import { Component, ChangeDetectorRef, ChangeDetectionStrategy } from '@angular/core'; @Component({ selector: 'graph', changeDetection: ChangeDetectionStrategy.OnPush, template: `<!-- svg, nodes and links visuals -->` }) export class GraphComponent { constructor(private ref: ChangeDetectorRef) { } ngOnInit() { this.graph = this.d3Service.getForceDirectedGraph(...); this.graph.ticker.subscribe((d) => { this.ref.markForCheck(); }); } }
Now Angular will update the graph on every tick, this is what we need.
That's all!
You survived this article and created a cool, scalable visualization. I hope that everything was clear and useful. If not, let me know!
Thank you for reading!
Liran sharir