Elasticsearch, Kibana and Logstash (ELK) is an excellent toolkit for collecting and visualizing large amounts of data.
Logs, logs, events - everything is pretty easy to assemble, map and display in a single toolkit. Logstash maps data, Elasticsearch stores it, and Kibana displays it in graphs.
With all the power of this bundle, of course, there are tasks that are impossible to implement through the built-in capabilities.
For example, Kibana perfectly displays data within a single table (index), but as soon as it comes to combining different indices into one sample, it spreads its hands helplessly.
And the only way to solve the problem in this case is to upload data from Kibana and combine them in any other tool, for example, in Excel.
A simple example. Imagine that your Fir-tree (ELK) collects and stores Jira events - for any change to any of the task tracker tasks.
In this case, the Elasticsearch index for one task will store several entries:
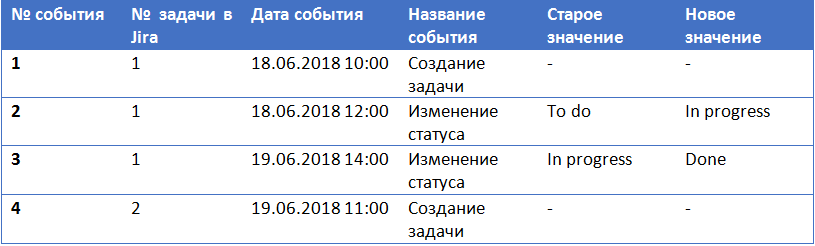
If you want to build a graph of events Jira, showing the conversion of tasks by state, then with the help of Kibana you can hardly do it. Due to the features of noSQL, you will need all the events for one task “to drive” into one Elasticsearch record.
This is quite difficult to do without attracting developers and rewriting Logstash configs.
The first thing that comes to your mind is to upload data from Kibana in order to manually spin it in normal Excel.
But the search for the upload button, to your great surprise, will fail, especially if Kibana is corporate and has limitations on the Reporting module:
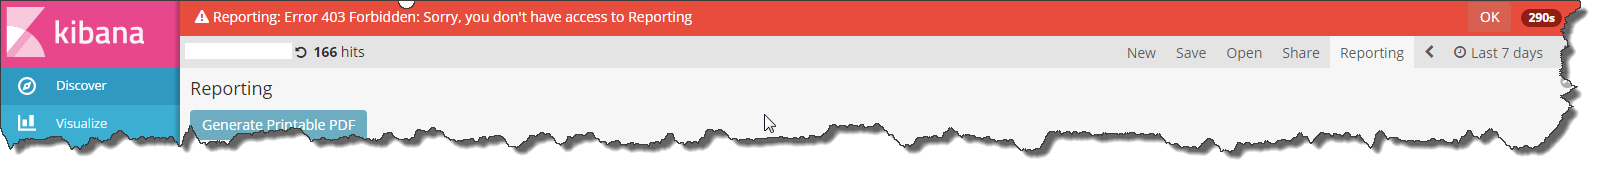
What is obtained, the data is, and you can not use them?
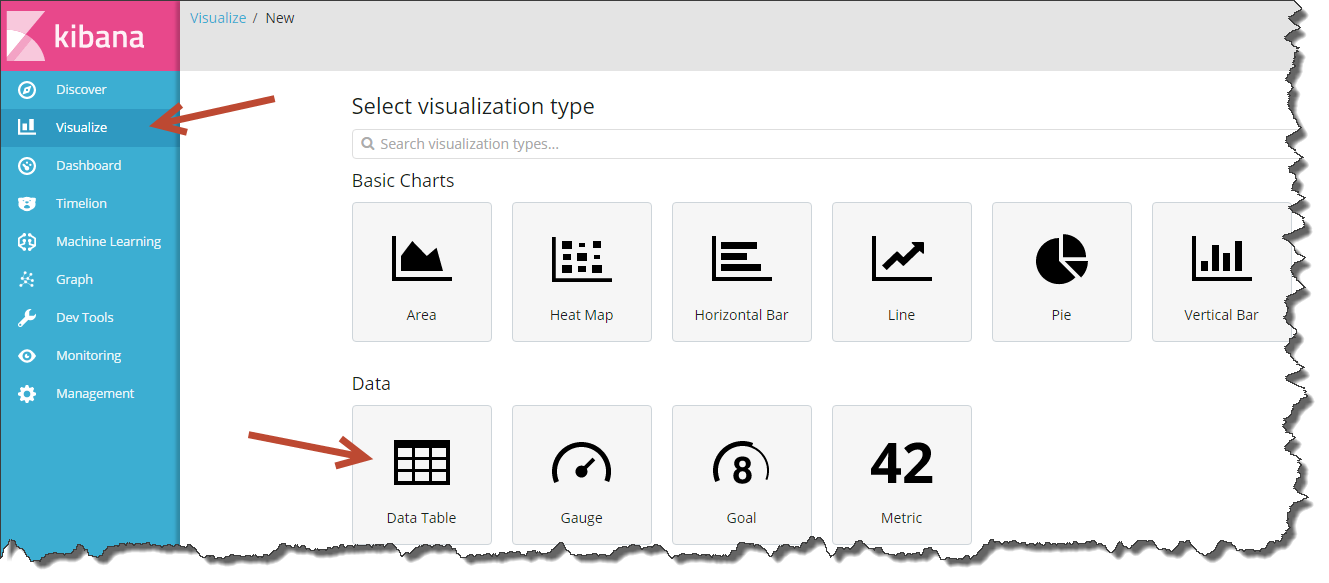
In fact, there is one secret way. Through the standard tabular report Data Table.
On the “Visualize” tab you can create many different reports, but only in the Data Table there is a button for uploading data in csv format.
If you work with Kibana, then you probably perceive the Data Table as an aggregate, i.e. a table in which you can calculate the total amount of something, but it’s impossible to list all the records. However, this is not quite true.
The table has a great function - Unique Count (count the number of unique elements), which you can use to display the entire list of records in a table.
Click “+” in the Visualize tab, select “Data Table” and specify the index from which you want to upload. In the table parameters, specify the unit - “Unique Count” and a field with a unique ID just below.
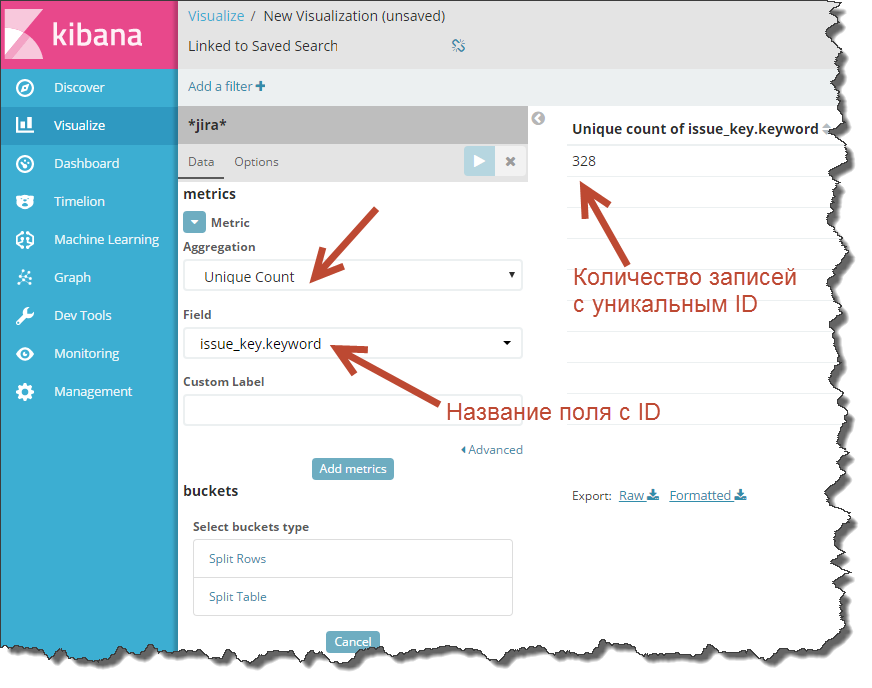
If you run the recount, Kibana will display the number of unique entries in the index.
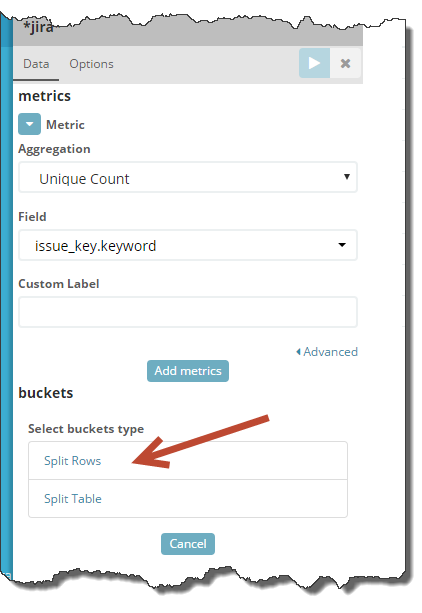
How to turn one number into a list of records? Very simple - using the Split Rows button
Click on it and select “Terms” as a unit (breakdown by field values).
This is a key point: in the "Field" specify a field with a unique record ID.
And, about a miracle, one number at recalculation of the table in the magic image turns into the table!
Here it is, the moment of truth.
What did you do? In a nutshell, you told Kibana that you want to count the number of unique records and also indicated the grouping of records on the basis of, namely, the unique values of the field you specified.
Now Kibana counts the number of elements in each group separately, and since as values you specified a unique ID of records, then Kibana began to count the number of unique records grouped by a unique ID, i.e. in fact, next to each row of the table, the “Unique Count” metric will be equal to “1”.
You got the desired result - you deduced all the entries and additionally counted how many rows you have in the index with the same ID.
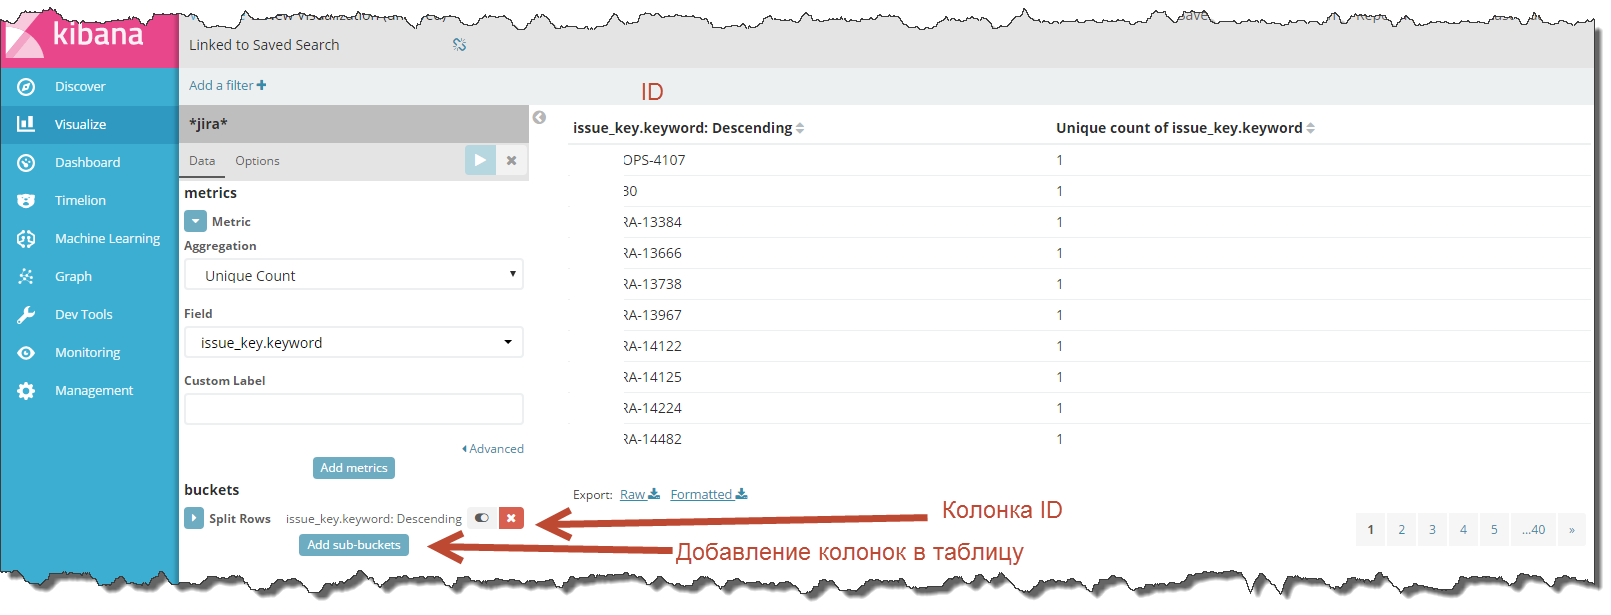
Now, if the columns in the table are not enough, add additional fields using the “Add sub-buckets” button and then “Split Rows”.
Everywhere, choose “Terms” as an aggregate and specify the names of the fields you want to add to the table.

Is done. You have received a full index upload.
All that's left to do is save the visualization and click the “Export Raw” or “Export Formatted” button.
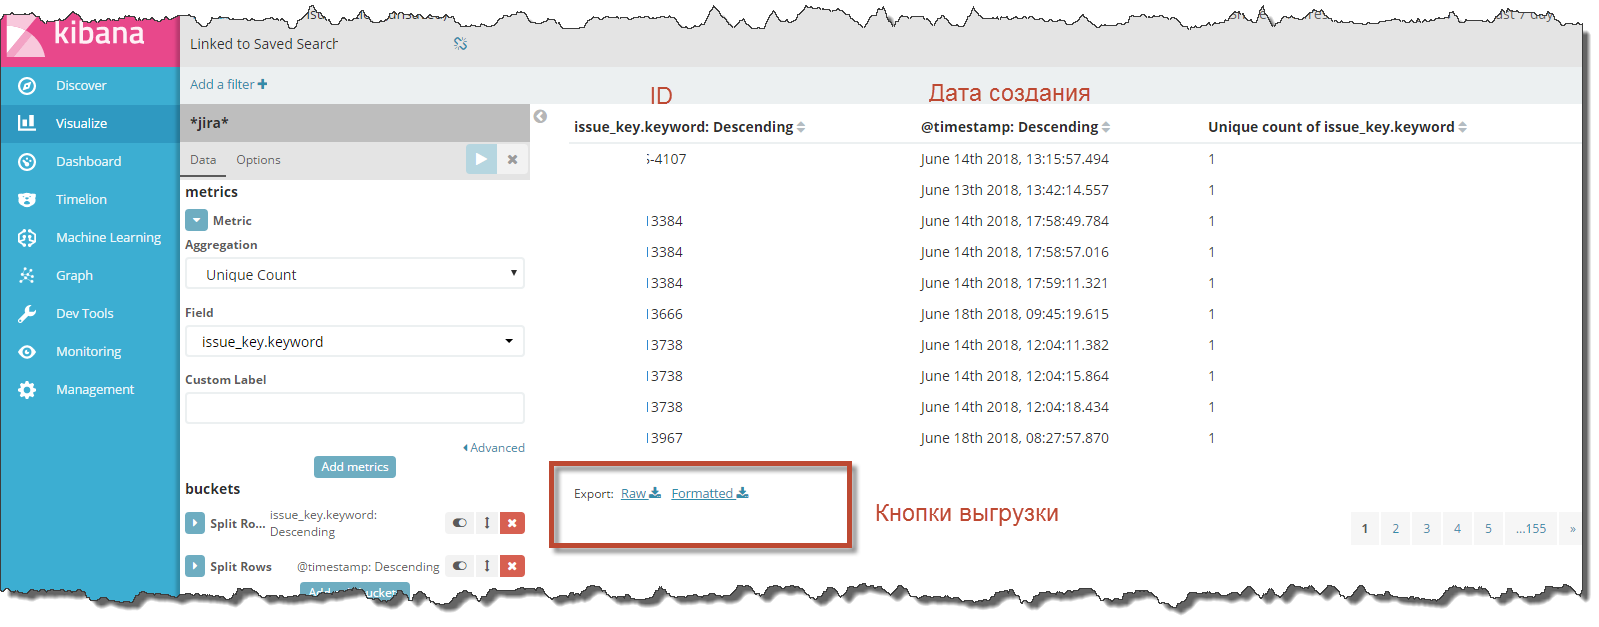
“Raw” unload everything in its raw form, and “Formatted” reformats the data according to the locale set in Kibana.
Everything.
As you can see, it is still possible to unload Kibana from an ordinary person who is not familiar with programming, although the solution does not lie on the surface.
I hope that with this little trick I will make life easier for someone and give the opportunity to quickly analyze the data without attracting developers for uploading.
If my experience helped you, I will be glad to see your comment on this article.