 Download AlgoLab from Google Disk ( AlgoLab (Excel 2007-2013) .xlsm and AlgoLab (Excel 97-2003) .xls files ).
What the Bolsheviks had been talking about for so long, and why I had been going for a few years at a different pace, had finally come to pass. A few years ago I wrote a small macro to create algorithmic gif-animation for habstaty. Over time, my humble instrument has grown to an impressive size, which is not ashamed now to show the world.
So meet.
AlgoLab is an Excel application (that is, an Excel file with macros), in which you can step by step familiarize yourself with the sorting algorithms. And also there is an opportunity to prepare gif-animation.
Generated Animation ExamplesSort by binary tree
Spaghetti Sorting
Sleeping sort

Only 4 sheets - 2 main and 2 so, information. Here they are:
 | |  |
| Sort sheet | Process sheet |
|---|
 |
 | |  |
| Sort Sheet | Sheet Graph |
|---|
Clicking on the picture will open a full-size image.- Sheet sort. On this sheet, you can quickly form an array and select a sorting algorithm.
- Sheet process. Here we observe step by step how this or that algorithm works.
- Sort Sheet. Here is a summary of the algorithms.
- Sheet Graph. Also shown is the planned schedule for the release of articles on sorting.
We will get acquainted with these sheets in more detail.
Sort sheet
The upper part of the sheet is devoted to the generation of an unsorted array (in order to be what is fed to the algorithm), as well as to save the visualization in the form of images on your computer:
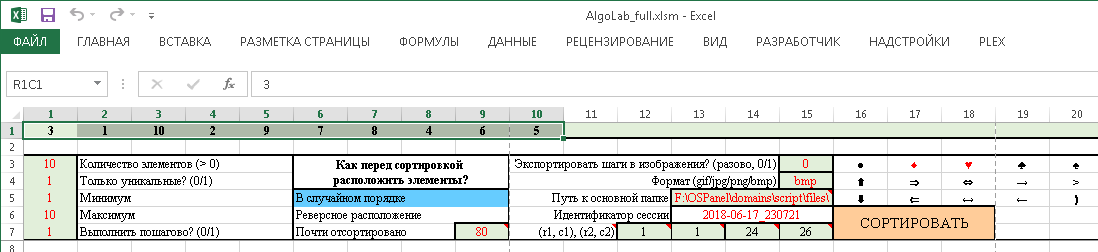
On the very first line is the array itself. If necessary, you can manually change the values of individual elements in it:

On the left in the upper part you need to specify the main characteristics for the generated array:

Size, should the values in the array be nonrecurring (0 - no, 1 - yes), to which the minimum and maximum elements in the array are equal. VBA macros are enabled to vandal-proof input data, so some incorrect values can be entered. In this case, the application itself will determine what this or that characteristic should be equal to.
As well as an option to determine whether to perform the algorithm step by step (= 1), or you can apply a sort to the structure and show only the final result (= 0). Of course, the excel application itself was created to observe the whole process in step-by-step mode, so the value is usually here equal to one. But sometimes, when testing, I reset this option to just check whether the new algorithm works at all, which I add to AlgoLab.xlsm (that is, I first need to see if its final result is a sorted array without wasting time viewing the visualization ).
A little to the right is the area in which you can specify how precisely the elements in the generated unsorted array are not sorted.

Generate randomly mixed array? Or maybe arrange the elements in descending order? Or do you make the array almost sorted (and also indicate the coefficient of sorting)?
To select any of these methods, you just need to click on the cell with the item. As a result, the array is regenerated in the first line. The selected cell will turn blue.
More to the left is the territory, which will be needed if you need to not only admire the visualization, but also save the whole process frame by frame as images.

First, you need to specify whether to sort the stages at all into images (= 0, if not, = 1 if yes, and this option is “one-time”, that is, it is reset to zero after the end of sorting). Secondly, you need to specify the image format (only 4 options are possible: GIF, JPG, PNG and BMP. The last option gives the highest quality result, so I recommend it). Thirdly, you need to specify the path to the folder where to save the pictures (click on this cell and the dialog window opens to select the directory). Then comes the cell that the macro fills in by itself - the session identifier (needed for the unique name of the subfolder, in order to save frames of this particular sorting application). And also it is necessary to correctly specify the capture area (the coordinates of the upper left and lower right cells, it is them that will limit the saved frames - do not copy the whole sheet?)

Well, in the rightmost part you will find the “Sort” cell (which serves as the process launch button, when you select a sort and generate an array, you just need to click on it).
There are also different special characters near this button that can be used in visualization. These cells do not need to touch.
At the bottom of the most important thing - the choice of algorithm. You just need to click on the name of the sort, after which the cell with it will turn blue.

Of the more than 80 algorithms, about half of them are available today. So far, unrealized ones have a pale appearance in comparison with those already implemented. Some have not yet had time to do (and did not even begin implementation). Some are under development. Some have been written and tested and will be available very soon (in particular, I have almost all the sorting inserts ready, but I will add them to the application as soon as the habilites are released on these sortings in the coming weeks and upload the updated AlgoLab.xlsm - and what to do, I do not want to spoil new episodes of my series).
I plan to modify some of the already implemented sorts. Visualization does not satisfy me everywhere.
But when you select an algorithm, a summary information about it is loaded into this area. The information is taken from the “Sort” sheet, they are automatically pulled up by the macro. By the way, if you change the text in this area, then it will change on the original sheet too.
Sorting, as you can see quite a lot. In order not to get entangled in all this magnificence, they are divided into classes, depending on what principle method of data ordering is used. What are these classes?
- Random sorting. The elements of the array are randomly shuffled and this continues until the structure is suddenly ordered.
- Sort exchanges. A total pairwise comparison (and exchange) of array elements is organized.
- Sort by inserts. Elements are moved and each is inserted into its place.
- Sort by choice. In the subarray, the maximum element is selected, which is inserted at the end of the subarray. Then the same procedure is repeated for the remaining unsorted part.
- Merge sorting. Looking for ordered subarrays that are connected to each other.
- Sort by distribution. Elements are divided into classes until this results in the desired result.
- Hybrid sorting. Combined methods of exchange, intercalation, elective, merging and distribution algorithms.
- Parallel sorting. Algorithms where parallel processing of different parts of the array is provided.
- Sorting nets. The array is passed through the sorting network, at the output it is ordered.
- Other sorting. Pseudo-algorithms, comic and just extravagant sorting.
In the upcoming habrastiyah will be covered in detailed nuances for each class. Well, we go to the next sheet.
Process sheet
Actually, when generating an array, choosing an algorithm and clicking on the “Sort” button, the macro throws on this sheet. This is where the mystery of data ordering takes place.
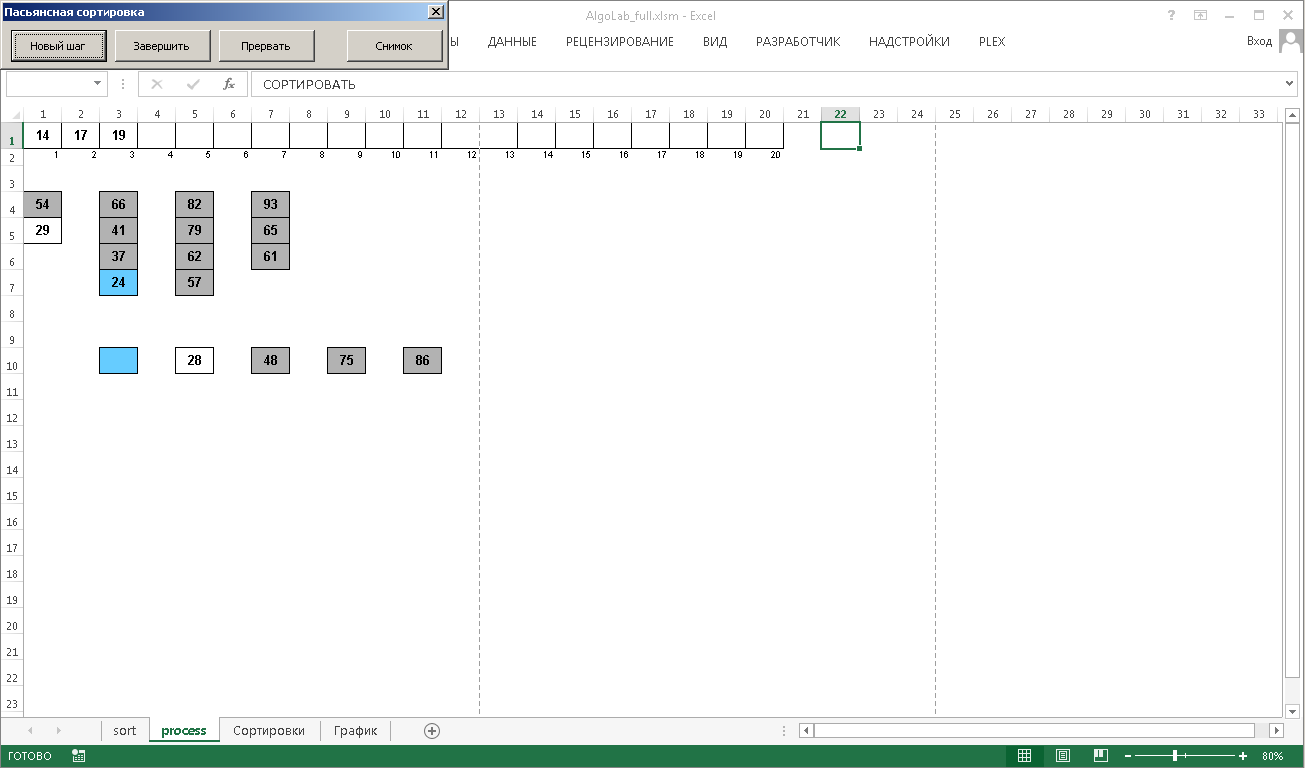
During the whole process at the top you will be accompanied by this wonderful window:
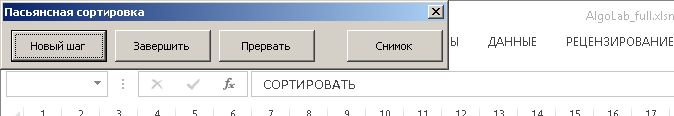
Since the browsing mode is step by step, in order to go to the next step, it is necessary to
press the “New step” button in it. Doing this with a mouse is not very convenient, so the focus of the input window is always on this button. That is, to proceed to the next steps, you just have to not be lazy to push the keyboard Enter (no other gestures are required).
The "Finish" button takes the process out of a step by step view. The algorithm will silently finish its work and show only the final result. The final stage of the work of sorting you will not see.
The “Abort” button completely stops the macros in this step.
The "Snapshot" button allows you to save a screenshot of this particular step. Then you will find the picture in the folder specified in the settings on the sort sheet.
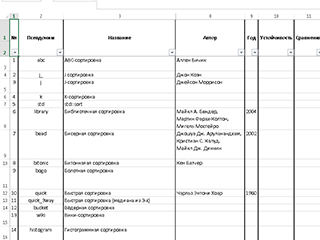
Sort Sheet
There is a huge table with all sorts of knowledge about sorting. As you remember, the information is pulled from here when choosing sorting on the sort sheet. I repent, while the quality of the filling is so-so, I did not have enough assiduity in order to painstakingly enter the maximum amount of correct data. Hope to catch up in the very near future.
Sheet Graph
On this sheet you can familiarize yourself with my fantasies about the dates of the nearest exits of the sorting.

I will talk about the algorithms in this order.
Exchanges → Inserts → Selection → Merge → Distribution →
→ Hybrids → Parallel → Network → Random
The general classes are listed, but in general, each class will be devoted to several opuses obeying such a general scheme.
- Description of the sorting class. Introductory, basic nuances inherent in all class sorts, basic class sorts. Usually these introductory articles will contain fairly well-known information. But anyway, I will try to avoid being bored.
- Some little known class sorting. Here I will delight you with new material, about which there is practically no information in Russian. And something you will not find even in English. Separate articles will not be only about sorting exchanges, because there already a long time ago there is no interesting exclusive.
- A practical comparison of class sorts with each other. For each group of algorithms there will be a final article devoted to testing sorting on different data sets. Here I promise a lot of amazing discoveries!
A practical comparison of sorts
It was planned to compare only the python-implementation of algorithms. However, having seen the first results on the example of dwarf sorting, I came to the conclusion that they would give a wrong idea of the relative speed.
Python has its own variable memory access system (especially if these variables are assigned to each other), which is why optimized algorithms may run slower.
| Dwarf sort | Optimized gnome sorting |
|---|
 |  |
|---|
def gnome(data): i, size = 1, len(data) while i < size: if data[i - 1] <= data[i]: i += 1 else: data[i - 1], data[i] = data[i], data[i - 1] if i > 1: i -= 1 return data
| def gnome_opt(data): i, j, size = 1, 2, len(data) while i < size: if data[i - 1] <= data[i]: i, j = j, j + 1 else: data[i - 1], data[i] = data[i], data[i - 1] i -= 1 if i == 0: i, j = j, j + 1 return data |
| 10 arrays of 1000 elements each |
| Total time: 3.39134 seconds | Total time: 5.6809 sec. |
The situation is similar with Shaker / Bubble. Bubble sorting, contrary to expectations, is faster than shaker sorting (although Shaker Sort is an improved Bubble sort).
For control, I tested the sorting in PHP (I mostly work in this language, so the alternative test was the quickest and easiest to create exactly on it). There is already a “normal” situation - an optimized “gnome” on all data sets is clearly faster than the usual one.
However, PHP also has a reputation for “imperfect” and slow means, so I decided that it is not suitable for global conclusions. To minimize possible reproaches [in choosing the wrong language for testing real speed], I decided to do basic tests in Java as well. However, faced with a shortage of their knowledge for this language. Alas, it did not grow together.
Thus, testing will be in
three two languages at once:
- Python. First of all, this language is most suitable for the description of the algorithm. Since there are working correct functions, then we will measure time for them. But the results will be somewhat dubious.
- PHP Initially I was not going to use this language in a series of articles. But since I wrote an environment on it to test the sortings and the implementations themselves on this PL are available, then why not. Practical results by which one can judge the relative efficiency of algorithms are more adequate compared to Python.
Java It is by the results on Java that we will draw the main conclusions.
Of course, all options in all languages will be shared.
FAQ
Already I foresee some questions from the floor, I will answer immediately.
Why is the program for visualization of algorithms implemented in Excel?
So at one time it was the fastest and easiest (for me). The gridded space of spreadsheets turned out to be a very, very convenient, ready-made solution for visualizing work with arrays.
Ok, we will sort all these sortings. What's next?
On the basis of AlgoLab I will do visualizations for trees, graphs. Ulama tablecloth, Langton ant, that's all. There are blanks for 2048 (AI plays using a minimax and the Monte Carlo method - you need to finish it). Works - no end.
Links
Download AlgoLab from Google Disk ( AlgoLab (Excel 2007-2013) .xlsm and AlgoLab (Excel 97-2003) .xls files ).Series articles