We continue to discuss topics raised at the You Gonna Love Frontend Conference. This article is inspired by the report of Michaela Lehr . Video from the conference will be available this week while there are slides . ( Video is already available )
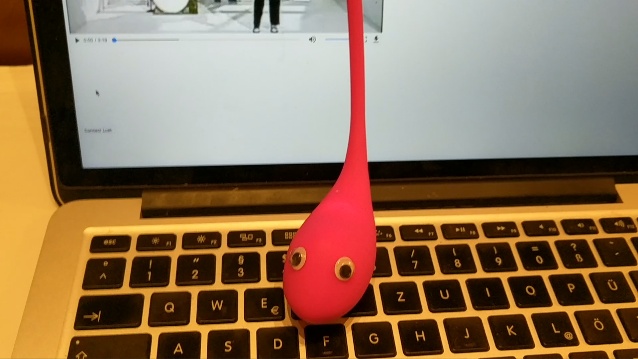
Michaela Lehr connected a vibrator to the browser using Web APIs, namely the Web Bluetooth API. Prosniferife traffic between the application and the vibrator, she found that the commands sent are very simple, for example: vibrate: 5 . Then, having taught him to vibrate to the sound of groans from videos she could find on the Internet, she achieved her goals :)
I do not have such toys and the design does not provide for use, but there is a Polar H10 heart rate monitor, which uses Bluetooth for data transmission. Actually, I decided to “hack” him.
Hacking will not be
First of all, it is worth understanding how to connect the device to the browser? Google or Yandex depending on your inclinations: Web Bluetooth API , and on the first link we see an article on this topic.
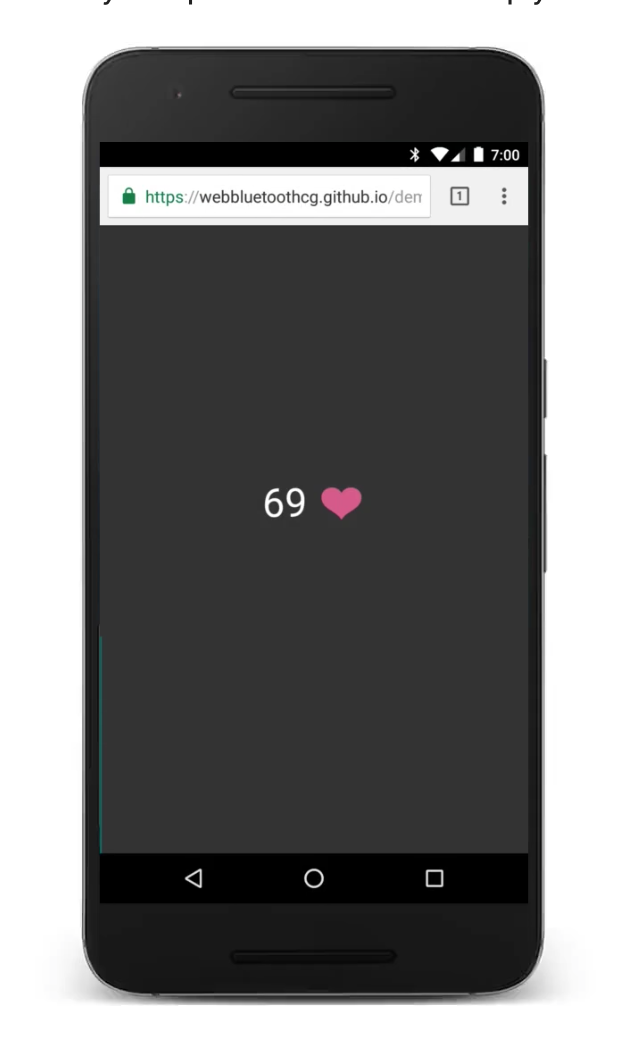
Unfortunately, everything is much simpler and there is nothing to remove if you don’t want to send something to the device that doesn’t want it. In the same article there is even a demonstration of a connected heart rate monitor.
I was wildly discouraged, even the source is. What time is it?
We connect the device
Let's create index.html with a typical markup:
<!DOCTYPE html> <html lang="en"> <head> <meta charset="UTF-8"> <meta name="viewport" content="width=device-width, initial-scale=1.0"> <meta http-equiv="X-UA-Compatible" content="ie=edge"> <title>Document</title> </head> <body> </body> </html>
Since my heart rate monitor device is certified though forged in Chinese workshops, but with the observance of standards, its connection and use should not cause any difficulties. There is such a thing - Generic Attributes (GATT) . I did not go into much detail, but if simple, then this is a kind of specification which is followed by Bluetooth devices. GATT describes their properties and interactions. For our project, that's all we need to know. A useful link for us is also a list of services (devices after the fact). Here I found the Heart Rate service (org.bluetooth.service.heart_rate) which looks like what we need.
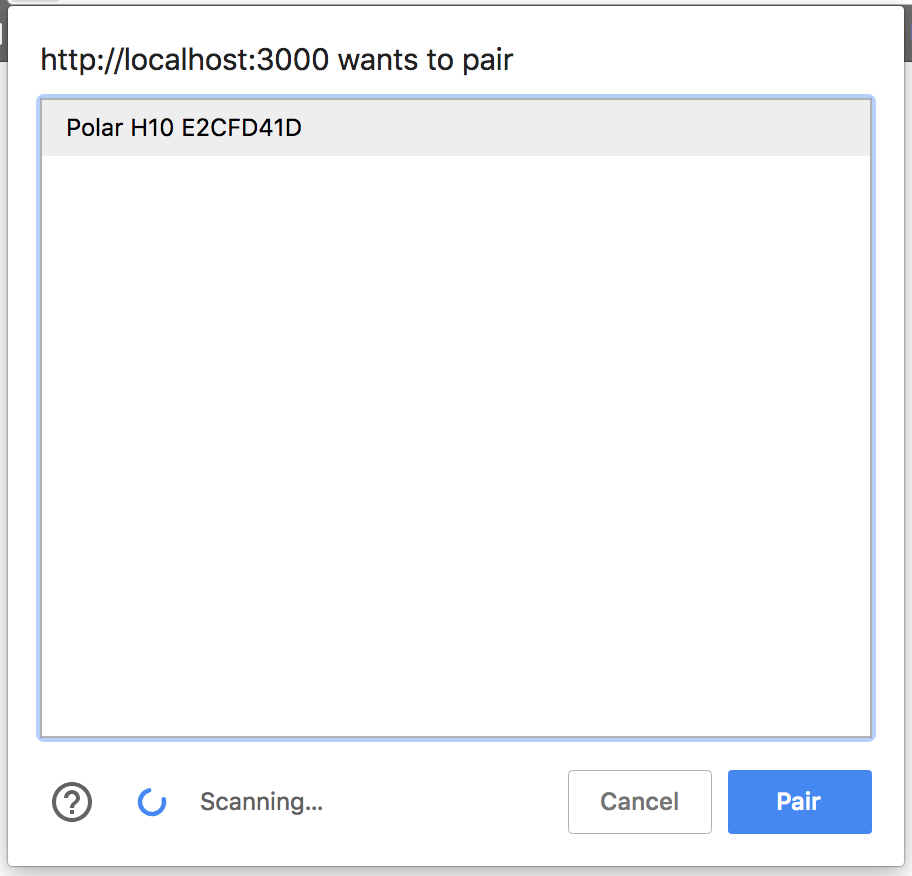
In order to connect the device to the browser, the user must consciously interact with the UI. So-so security is of course, given that when entering the room my heart rate monitor silently connects to everything that it pleases (at the time I was surprised by this). Thanks, of course, to browser developers, but why ?! Well, okay, not difficult and not so disgusting.
Let's add a button and a handler to the page in <body> :
<button id="pair">Pair device</button> <script> window.onload = () => { const button = document.getElementById('pair') button.addEventListener('pointerup', function(event) { </script>
As you can see, there is no Vue here, which I promised judging by the title. But I do not know everything myself and write an article along the way. So, while we do this way :)
In order to connect the device, we must use navigator.bluetooth.requestDevice . This method can accept an array of filters. Since our application will work for the most part only with heart rate monitors, we filter on them:
navigator.bluetooth.requestDevice({ filters: [{ services: ['heart_rate'] }] })
Open the html file in a browser or use browser-sync :
browser-sync start
I am wearing a heart rate monitor and after a few seconds Chrome found it:
After we have found the device we need, we need to read data from it. To do this, connect it to the GATT server:
navigator.bluetooth.requestDevice({ filters: [{ services: ['heart_rate'] }] }) .then((device) => { return device.gatt.connect(); })
The data we want to read are in the characteristics of the service (Service Characteristics). The heart rate monitor has only 3 characteristics, and we are interested in org.bluetooth.characteristic.heart_rate_measurement
In order to consider this characteristic, we need to get the main service. Honestly I do not know, WHY. Perhaps some devices have several sub services. Then get a testimonial and subscribe to notifications.
.then(server => { return server.getPrimaryService('heart_rate'); }) .then(service => { return service.getCharacteristic('heart_rate_measurement'); }) .then(characteristic => characteristic.startNotifications()) .then(characteristic => { characteristic.addEventListener( 'characteristicvaluechanged', handleCharacteristicValueChanged ); }) .catch(error => { console.log(error); }); function handleCharacteristicValueChanged(event) { var value = event.target.value; console.log(parseValue(value)); }
parseValue function, which is used for parsing data, you can find the data specification here - org.bluetooth.characteristic.heart_rate_measurement . We will not dwell on this function in detail, everything is trivial.
parseValue parseValue = (value) => { // Chrome 50+ DataView. value = value.buffer ? value : new DataView(value); let flags = value.getUint8(0); // let rate16Bits = flags & 0x1; let result = {}; let index = 1; // if (rate16Bits) { result.heartRate = value.getUint16(index, true); index += 2; } else { result.heartRate = value.getUint8(index); index += 1; } // RR let rrIntervalPresent = flags & 0x10; if (rrIntervalPresent) { let rrIntervals = []; for (; index + 1 < value.byteLength; index += 2) { rrIntervals.push(value.getUint16(index, true)); } result.rrIntervals = rrIntervals; } return result; }
Took from here: heartRateSensor.js
And so, in the console, we see the data we need. Besides the pulse, my heart rate monitor also shows RR intervals. I never figured out how to use them, this is your homework :)
Full page code <!DOCTYPE html> <html lang="en"> <head> <meta charset="UTF-8"> <meta name="viewport" content="width=device-width, initial-scale=1.0"> <meta http-equiv="X-UA-Compatible" content="ie=edge"> <title>Document</title> </head> <body> <button id="pair">Pair device</button> <script> window.onload = () => { const button = document.getElementById('pair') parseValue = (value) => { // Chrome 50+ DataView. value = value.buffer ? value : new DataView(value); let flags = value.getUint8(0); // let rate16Bits = flags & 0x1; let result = {}; let index = 1; // if (rate16Bits) { result.heartRate = value.getUint16(index, true); index += 2; } else { result.heartRate = value.getUint8(index); index += 1; } // RR let rrIntervalPresent = flags & 0x10; if (rrIntervalPresent) { let rrIntervals = []; for (; index + 1 < value.byteLength; index += 2) { rrIntervals.push(value.getUint16(index, true)); } result.rrIntervals = rrIntervals; } return result; } button.addEventListener('pointerup', function(event) { navigator.bluetooth.requestDevice({ filters: [{ services: ['heart_rate'] }] }) .then((device) => { return device.gatt.connect(); }) .then(server => { return server.getPrimaryService('heart_rate'); }) .then(service => { return service.getCharacteristic('heart_rate_measurement'); }) .then(characteristic => characteristic.startNotifications()) .then(characteristic => { characteristic.addEventListener('characteristicvaluechanged', handleCharacteristicValueChanged); }) .catch(error => { console.log(error); }); function handleCharacteristicValueChanged(event) { var value = event.target.value; console.log(parseValue(value)); // See https://github.com/WebBluetoothCG/demos/blob/gh-pages/heart-rate-sensor/heartRateSensor.js } }); } </script> </body> </html>
Design
The next step is to consider the design of the application. Oh, of course simple at first sight, the article turns into a non-trivial task. I want to use all sorts of pretentious things and already in my head there is a line of articles that need to be read by CSS Grids, Flexbox and manipulating CSS animations using JS (Pulse Animation is not a static matter).
Sketch
I like beautiful design, but the designer is so-so.
I do not have a photoshop, we will somehow get out along the way.
First, let's create a new Vue.js project using Vue-cli
vue create heart-rate
I chose manual configuration and the first page of settings looks like this for me:

Next, choose for yourself, but I have the config Airbnb, Jest and Sass.
Looked at half the lessons on CSS Grids from Wes Bos , I recommend, they are free.
It's time to do the initial layout. We will not use any CSS frameworks, all ours. Of course, we do not even think about support.
Owl drawing magic
And so, first of all, let's define our layout . In fact, the application will consist of two parts. We will call them so - first and second . In the first part we will have a numerical representation (beats per minute), in the second graph.
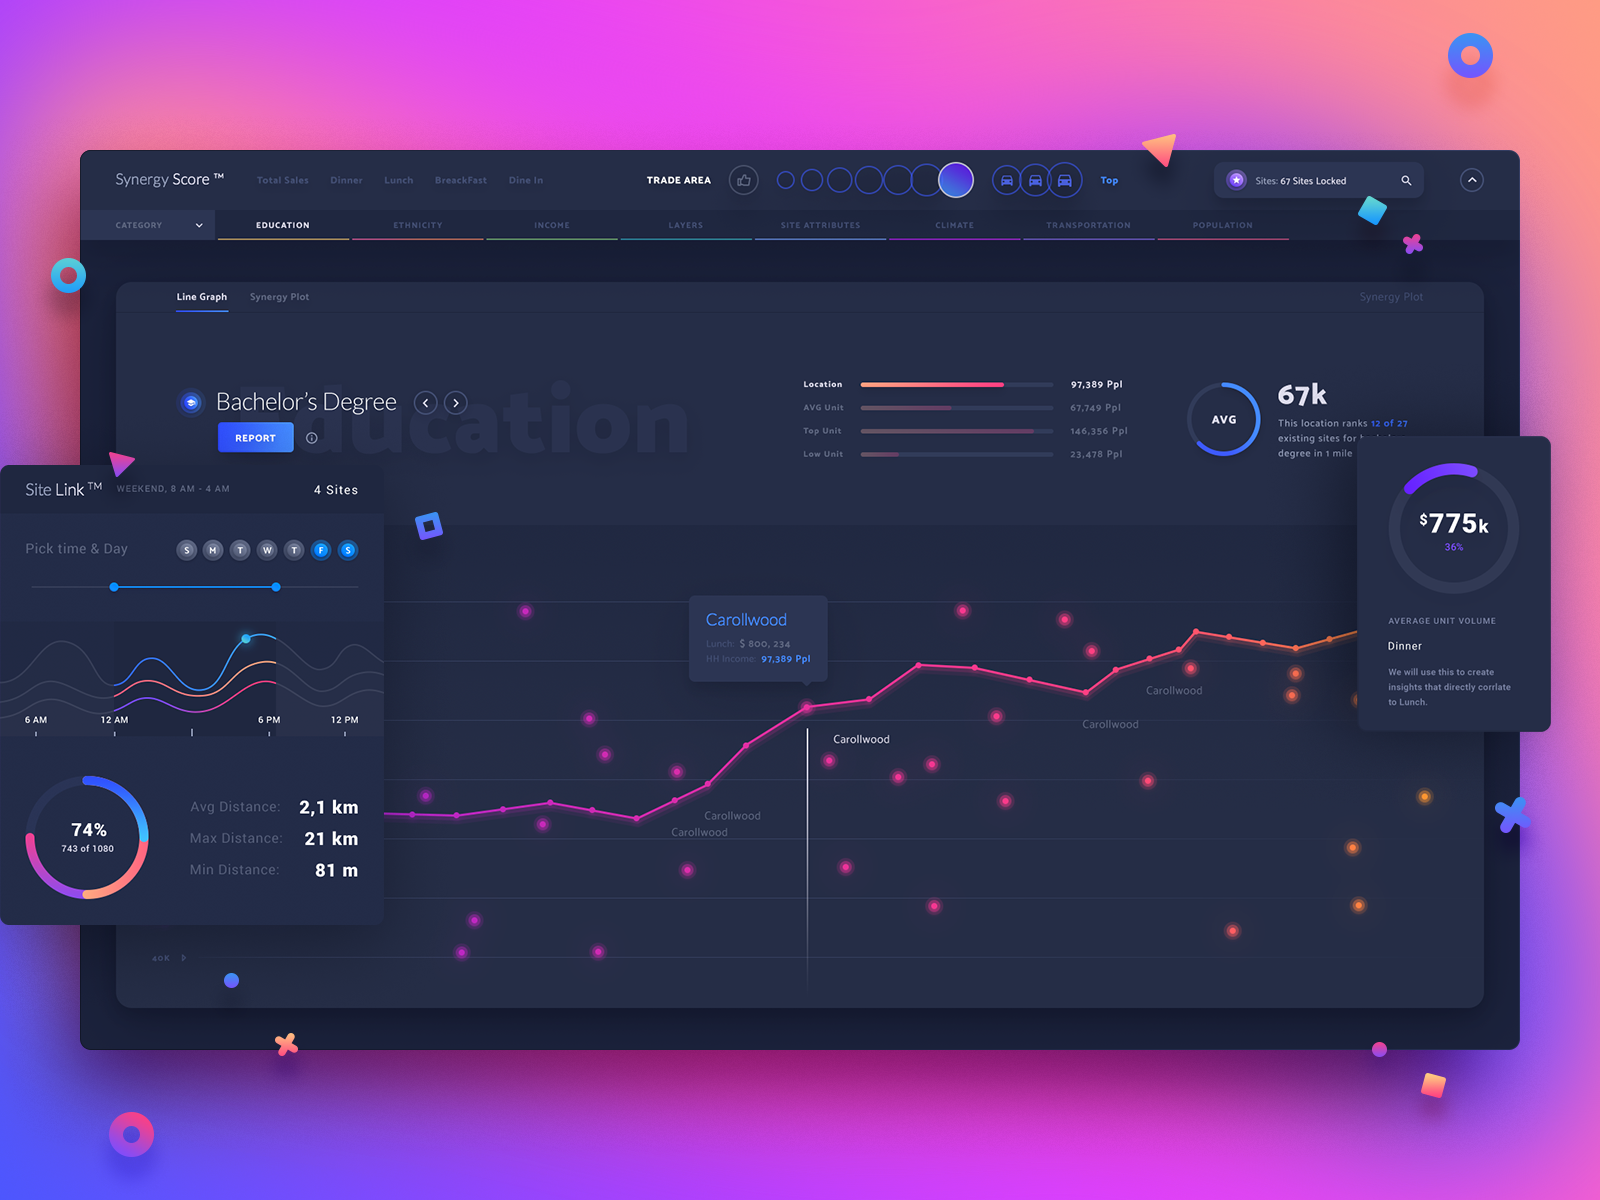
I decided to steal the color scheme from here .
Run our Vue application, if you have not done it yet:
npm run serve
Tulsa will open the browser itself (or not), there is a hot reload and a link for external testing. I immediately put a mobile phone near me, because we are thinking about mobile first design. Unfortunately, I added to the PWA template, and on a mobile phone, the cache is cleared when the browser is closed, but it happens and it is updated to save. In general, an incomprehensible moment with which I did not understand.
utils.js , utils.js add utils.js , with our function of parsing values, having a little refactored it under eslint in the project.
utils.js export const parseHeartRateValues = (data) => { // Chrome 50+ DataView. const value = data.buffer ? data : new DataView(data); const flags = value.getUint8(0); // const rate16Bits = flags & 0x1; const result = {}; let index = 1; // if (rate16Bits) { result.heartRate = value.getUint16(index, true); index += 2; } else { result.heartRate = value.getUint8(index); index += 1; } // RR const rrIntervalPresent = flags & 0x10; if (rrIntervalPresent) { const rrIntervals = []; for (; index + 1 < value.byteLength; index += 2) { rrIntervals.push(value.getUint16(index, true)); } result.rrIntervals = rrIntervals; } return result; }; export default { parseHeartRateValues, };
Then remove all unnecessary from HelloWolrd.vue renaming it to HeartRate.vue , this component will be responsible for displaying beats per minute.
<template> <div> <span>{{value}}</span> </div> </template> <script> export default { name: 'HeartRate', props: { </script> // SCSS <style scoped lang="scss"> @import '../styles/mixins'; div { @include heart-rate-gradient; font-size: var(--heart-font-size); // } </style>
Create a HeartRateChart.vue for graphics:
// HeartRateChart.vue <template> <div> chart </div> </template> <script> export default { name: 'HeartRateChart', props: { values: { type: Array, default: () => [], . . }, }, }; </script>
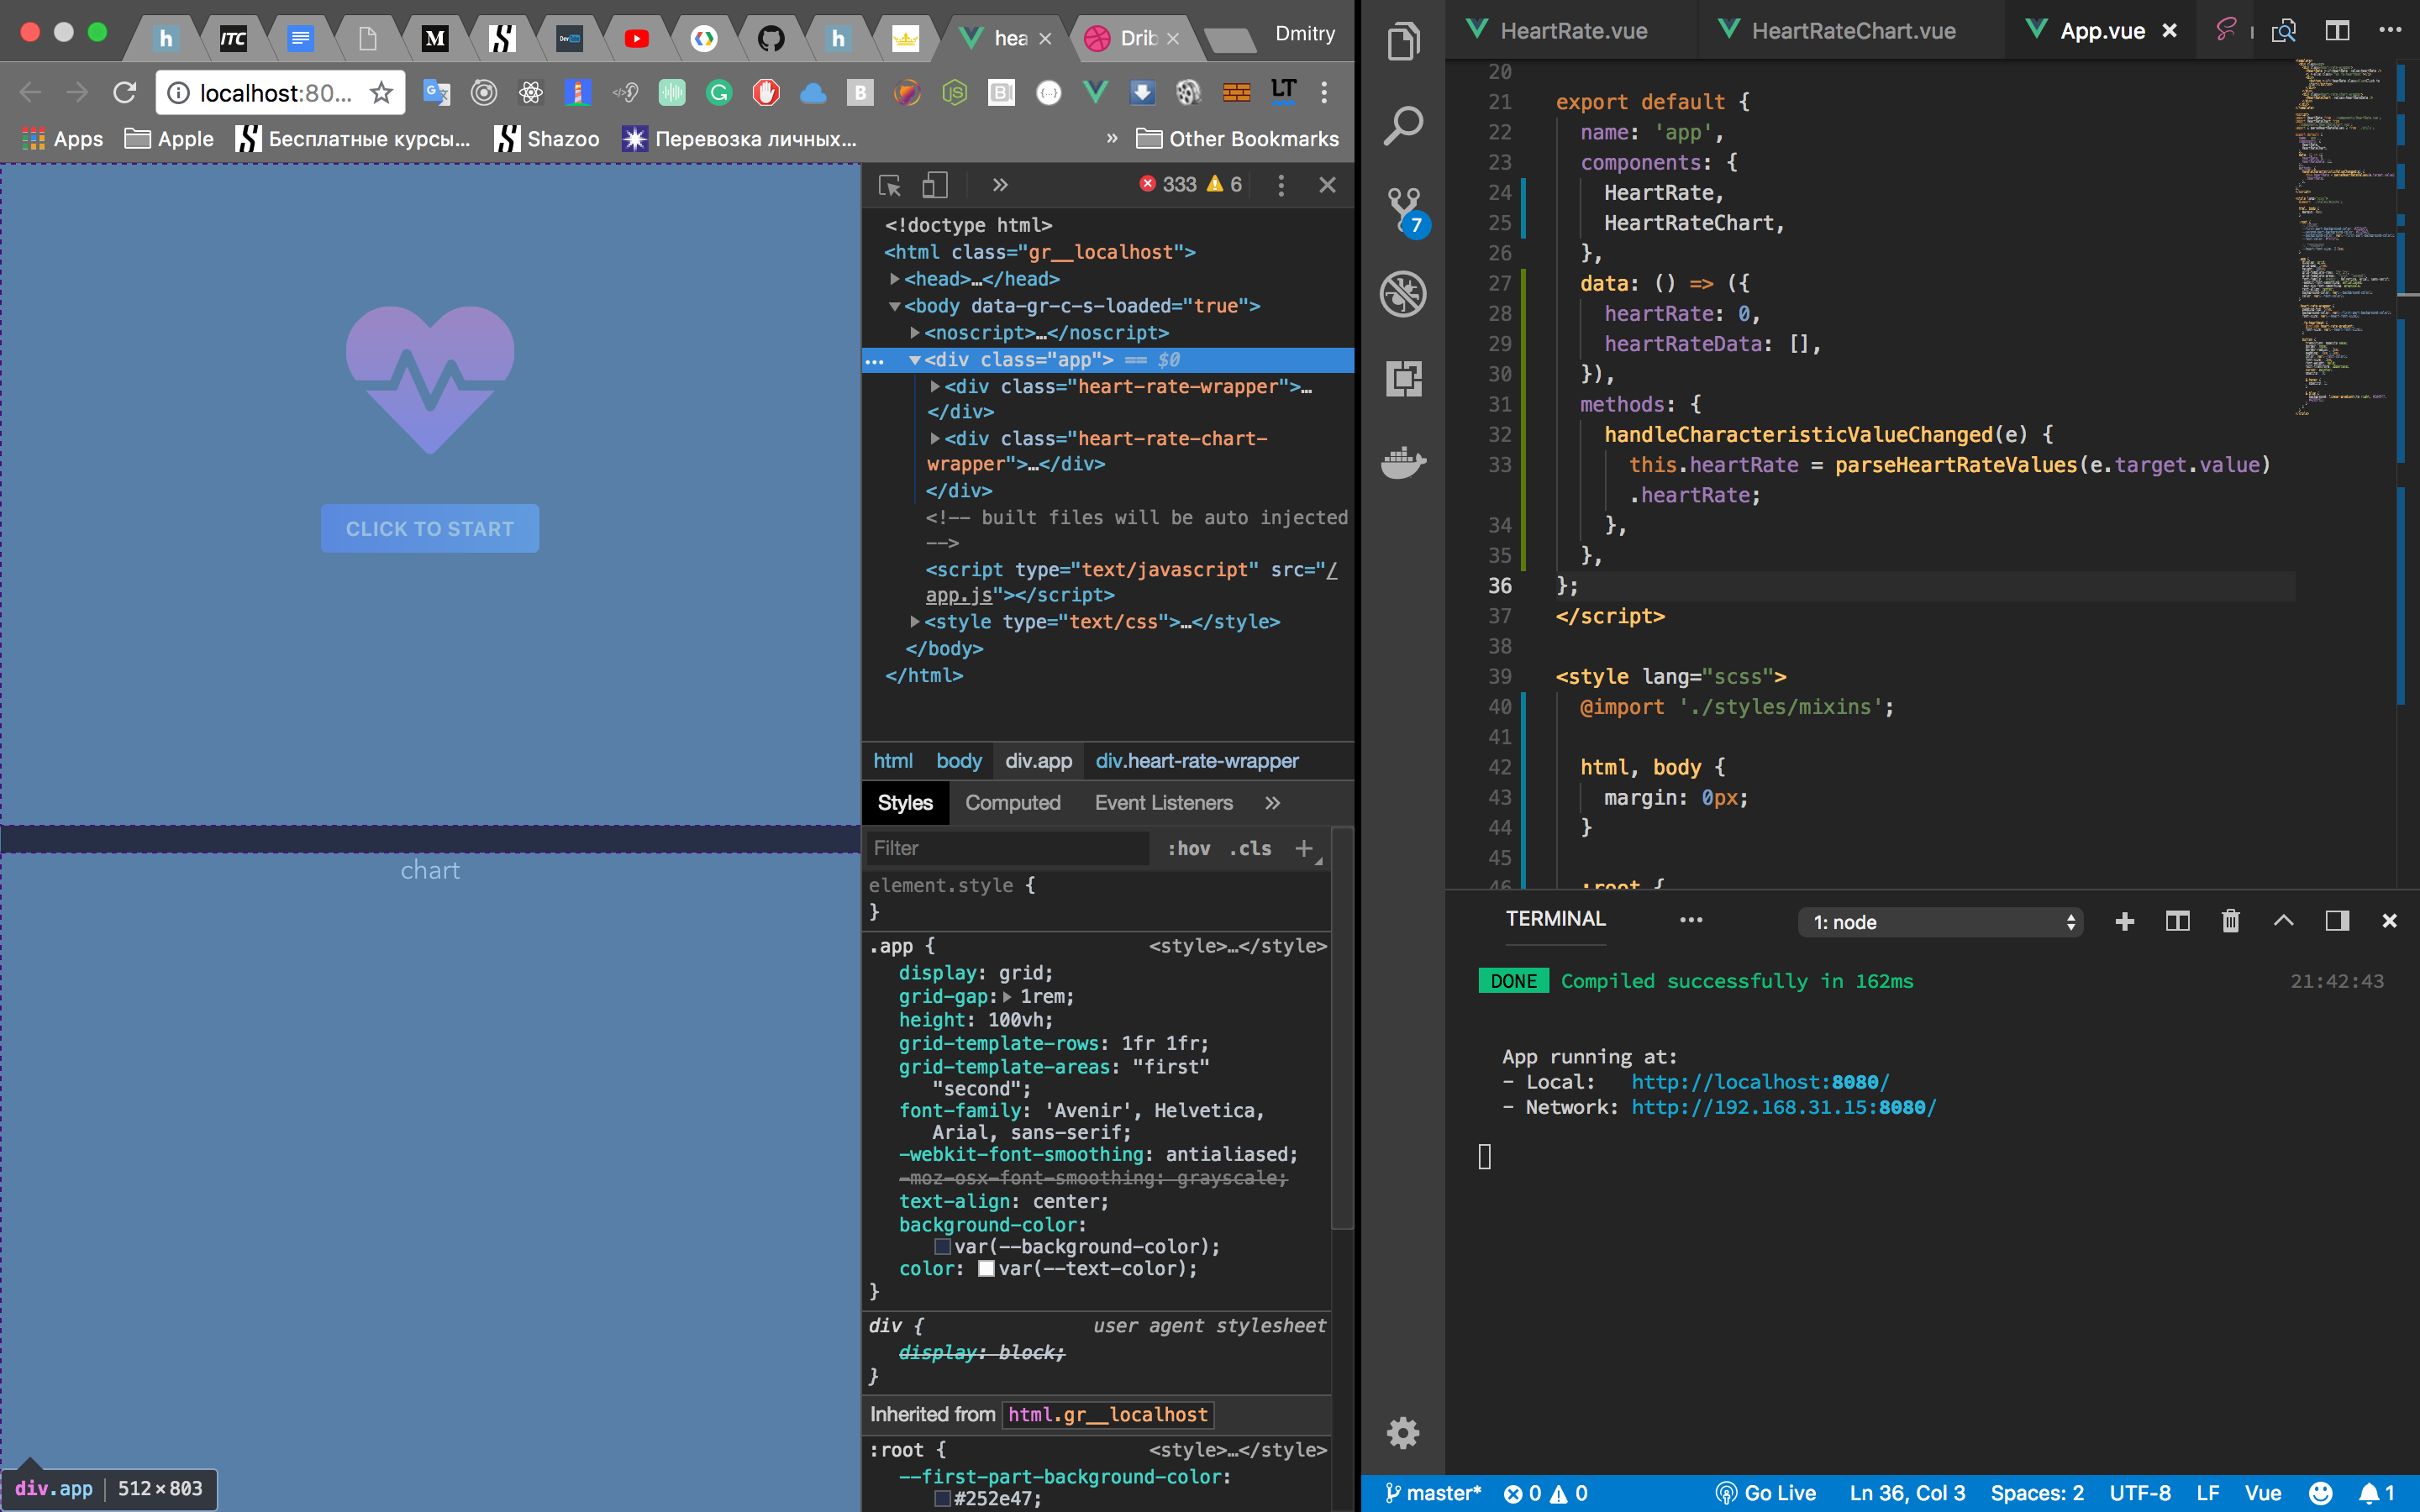
Update App.vue :
App.vue <template> <div class=app> <div class=heart-rate-wrapper> <HeartRate v-if=heartRate :value=heartRate /> <i v-else class="fas fa-heartbeat"></i> <div> <button v-if=!heartRate class=blue>Click to start</button> </div> </div> <div class=heart-rate-chart-wrapper> <HeartRateChart :values=heartRateData /> </div> </div> </template> <script> import HeartRate from './components/HeartRate.vue'; import HeartRateChart from './components/HeartRateChart.vue'; import { parseHeartRateValues } from './utils'; export default { name: 'app', components: { HeartRate, HeartRateChart, }, data: () => ({ heartRate: 0, heartRateData: [], }), methods: { handleCharacteristicValueChanged(e) { this.heartRate = parseHeartRateValues(e.target.value).heartRate; }, }, }; </script> <style lang="scss"> @import './styles/mixins'; html, body { margin: 0px; } :root { // COLORS
And actually, mixins.scss , while here there is only one mixin that is responsible for the color of the icon and the text that displays beats per minute.
@mixin heart-rate-gradient { background: -webkit-linear-gradient(#f34193, #8f48ed); -webkit-background-clip: text; -webkit-text-fill-color: transparent; }
It turned out like this:
Of the interesting points, the native CSS variables are used, but the mixins from SCSS.
The whole page is a CSS Grid :
display: grid; grid-gap: 1rem; height: 100vh; grid-template-rows: 1fr 1fr; grid-template-areas: "first" "second";
Like flexbox , the parent container must have some kind of display . In this case, the grid .
grid-gap is a kind of space between columns and rows .
height: 100vh - height for the whole viewport , it is necessary for fr occupy the space at full height (2 parts of our application).
grid-template-rows - define our template, fr is a sugar unit, which takes into account the grid-gap and other properties affecting the size.
grid-template-areas - in our example, just semantic.
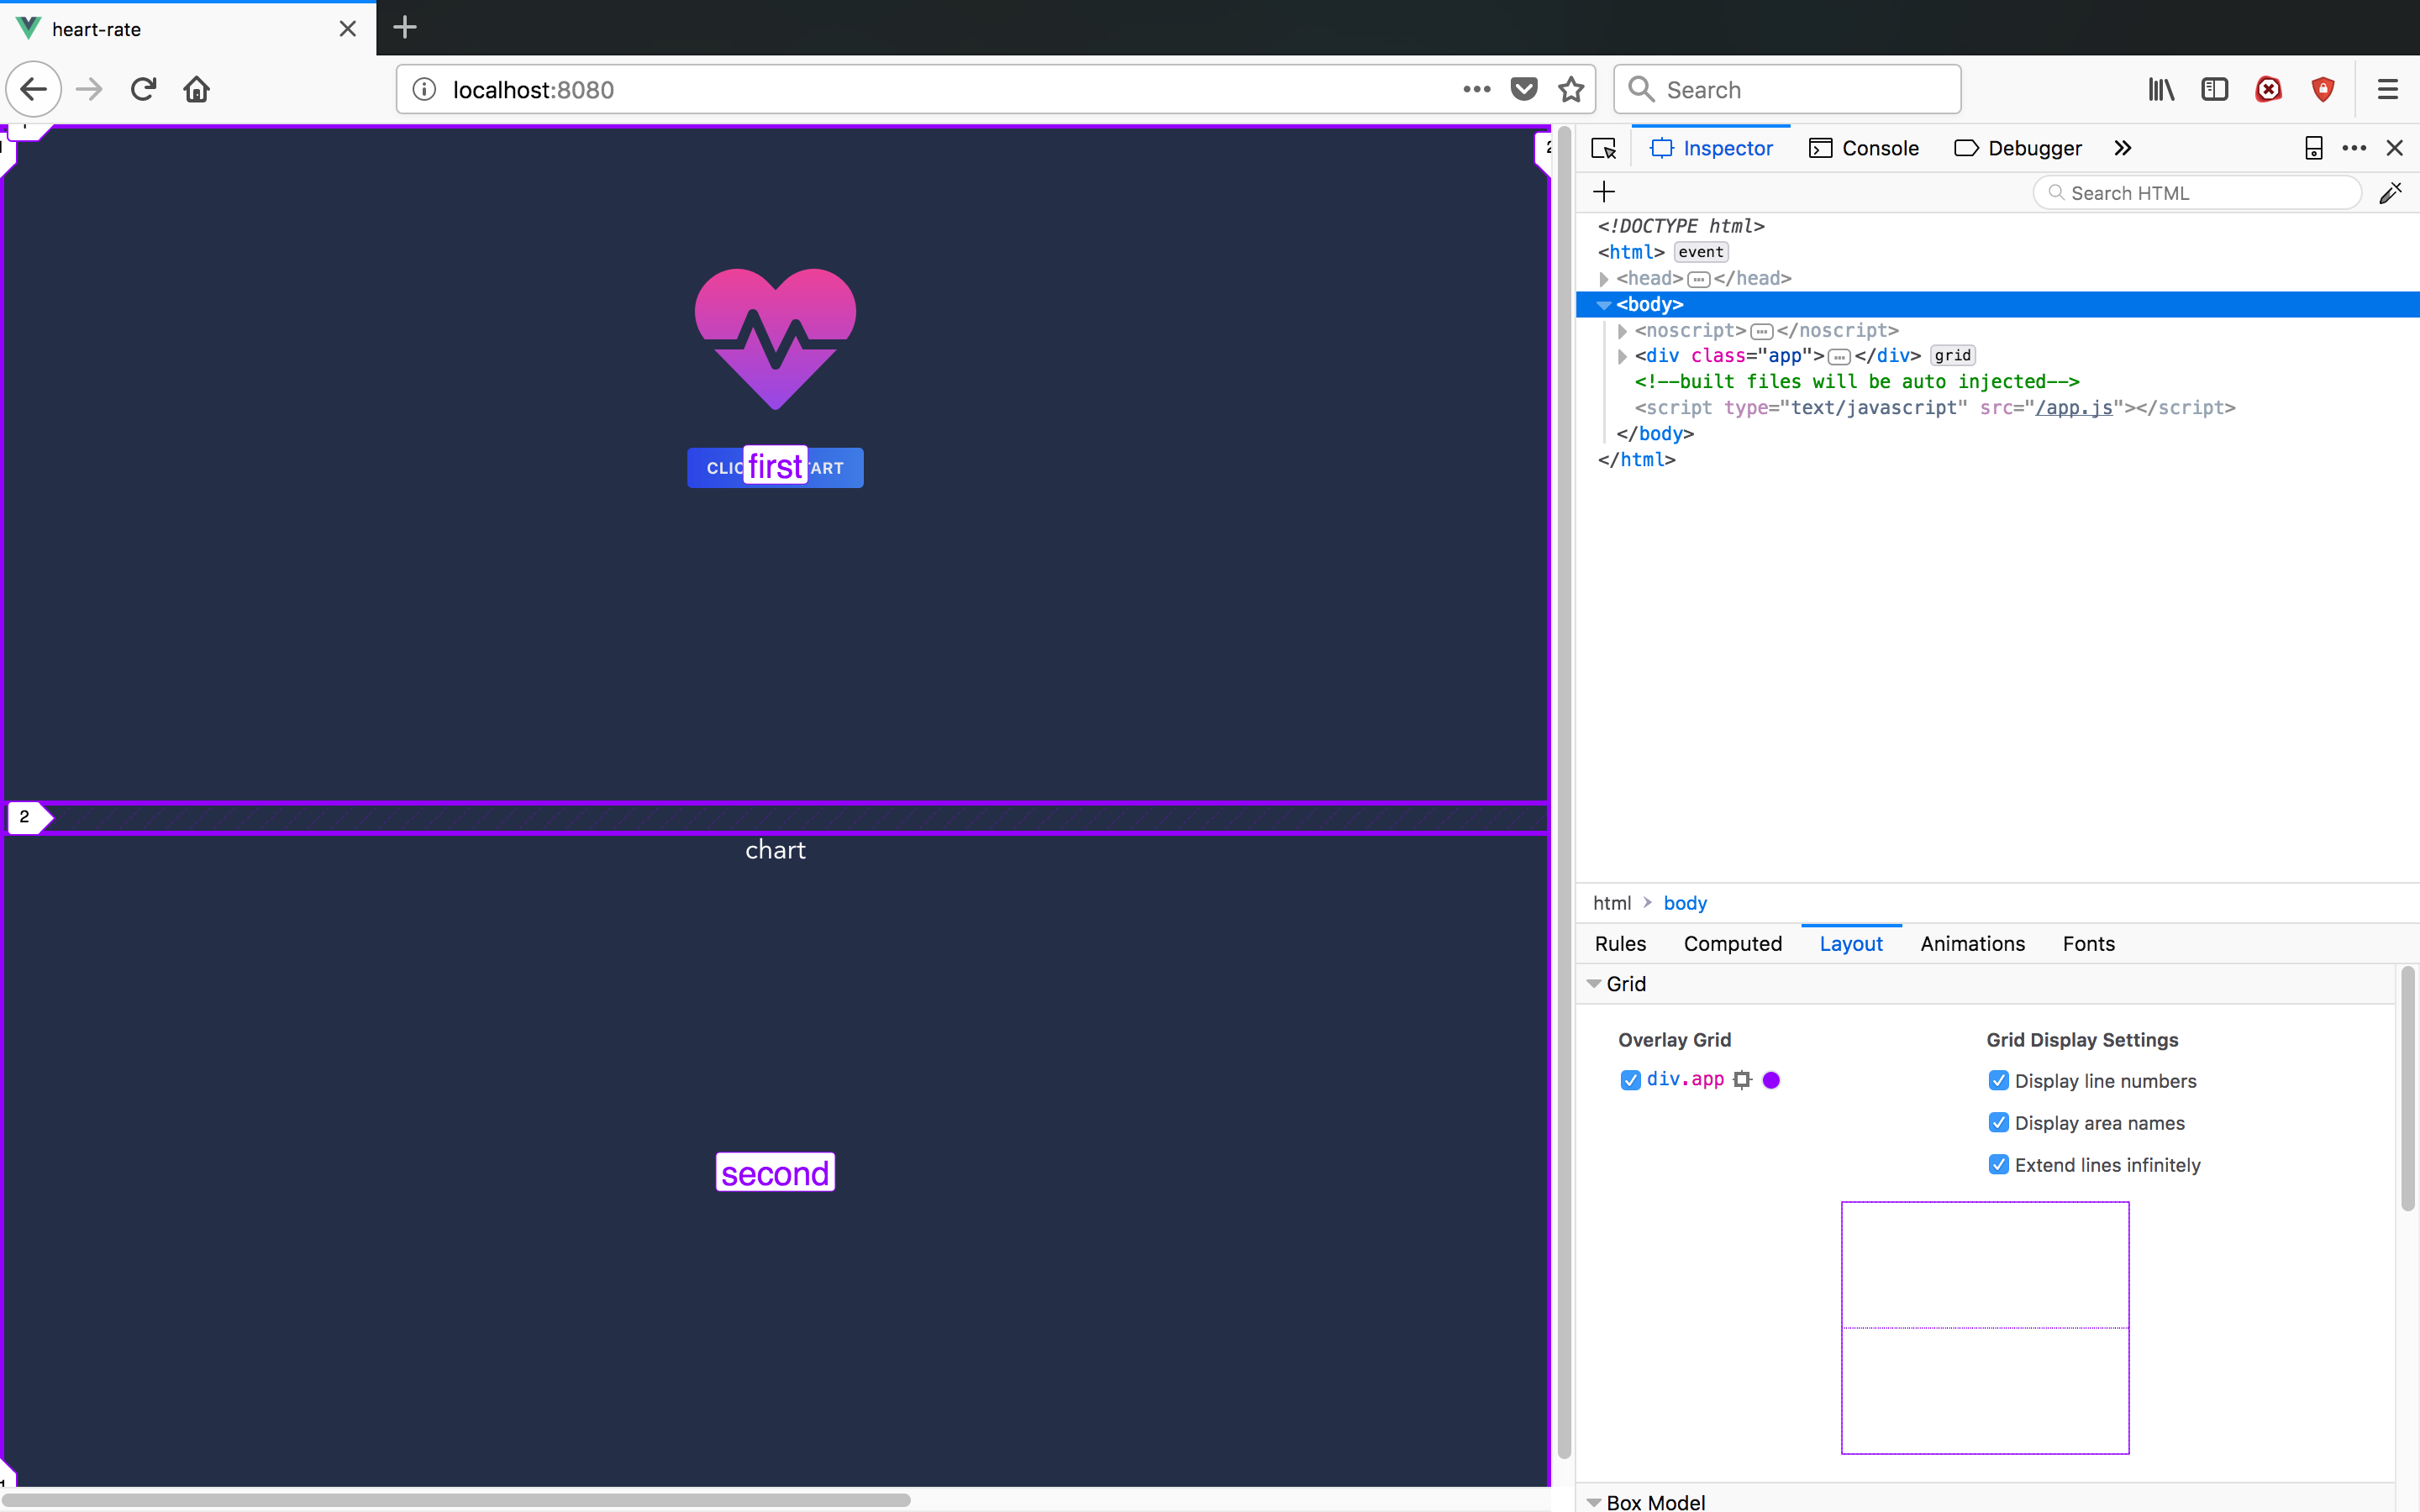
Chrome at the moment is still not delivered normal tools for inspection CSS Grids:
At the same time in the mace:
Now we need to add a click handler to the button, similarly as we did before.
Add handler:
// App.vue <button v-if=!heartRate @click=onClick class=blue>Click to start</button>
// Methods: {} onClick() { navigator.bluetooth.requestDevice({ filters: [{ services: ['heart_rate'] }], }) .then(device => device.gatt.connect()) .then(server => server.getPrimaryService('heart_rate')) .then(service => service.getCharacteristic('heart_rate_measurement')) .then(characteristic => characteristic.startNotifications()) .then(characteristic => characteristic.addEventListener('characteristicvaluechanged', this.handleCharacteristicValueChanged.bind(this))) .catch(error => console.log(error)); },
Do not forget that it works only in chrome and only in chrome on android :)
Next we will add a graph, we will use Chart.js and a wrapper for Vue.js
npm install vue-chartjs chart.js
Polar allocates 5 training zones . Therefore, we need to somehow distinguish between these zones and / or store them. We already have a heartRateData . For aesthetics, let's make the default value of the form:
heartRateData: [[], [], [], [], [], []],
We will scatter the values according to 5 zones:
pushData(index, value) { this.heartRateData[index].push({ x: Date.now(), y: value }); this.heartRateData = [...this.heartRateData]; }, handleCharacteristicValueChanged(e) { const value = parseHeartRateValues(e.target.value).heartRate; this.heartRate = value; switch (value) { case value > 104 && value < 114: this.pushData(1, value); break; case value > 114 && value < 133: this.pushData(2, value); break; case value > 133 && value < 152: this.pushData(3, value); break; case value > 152 && value < 172: this.pushData(4, value); break; case value > 172: this.pushData(5, value); break; default: this.pushData(0, value); } },
Vue.js ChartJS are used as follows:
// Example.js import { Bar } from 'vue-chartjs' export default { extends: Bar, mounted () { this.renderChart({ labels: ['January', 'February', 'March', 'April', 'May', 'June', 'July', 'August', 'September', 'October', 'November', 'December'], datasets: [ { label: 'GitHub Commits', backgroundColor: '#f87979', data: [40, 20, 12, 39, 10, 40, 39, 80, 40, 20, 12, 11] } ] }) } }
You import the desired graphic style, expand your component and use this.renderChart display the graphic.
In our case, it is necessary to update the schedule as new data becomes available, for this we hide the display in a separate updateChart method and call it on the mounted and using the watch to monitor the values :
HeartRateChart.vue <script> import { Scatter } from 'vue-chartjs'; export default { extends: Scatter, name: 'HeartRateChart', props: { values: { type: Array, default: () => [[], [], [], [], [], []], }, }, watch: { values() { this.updateChart(); }, }, mounted() { this.updateChart(); }, methods: { updateChart() { this.renderChart({ datasets: [ { label: 'Chilling', data: this.values[0], backgroundColor: '#4f775c', borderColor: '#4f775c', showLine: true, fill: false, }, { label: 'Very light', data: this.values[1], backgroundColor: '#465f9b', borderColor: '#465f9b', showLine: true, fill: false, }, { label: 'Light', data: this.values[2], backgroundColor: '#4e4491', borderColor: '#4e4491', showLine: true, fill: false, }, { label: 'Moderate', data: this.values[3], backgroundColor: '#6f2499', borderColor: '#6f2499', showLine: true, fill: false, }, { label: 'Hard', data: this.values[4], backgroundColor: '#823e62', borderColor: '#823e62', showLine: true, fill: false, }, { label: 'Maximum', data: this.values[5], backgroundColor: '#8a426f', borderColor: '#8a426f', showLine: true, fill: false, }, ], }, { animation: false, responsive: true, maintainAspectRatio: false, elements: { point: { radius: 0, }, }, scales: { xAxes: [{ display: false, }], yAxes: [{ ticks: { beginAtZero: true, fontColor: '#394365', }, gridLines: { color: '#2a334e', }, }], }, }); }, }, }; </script>
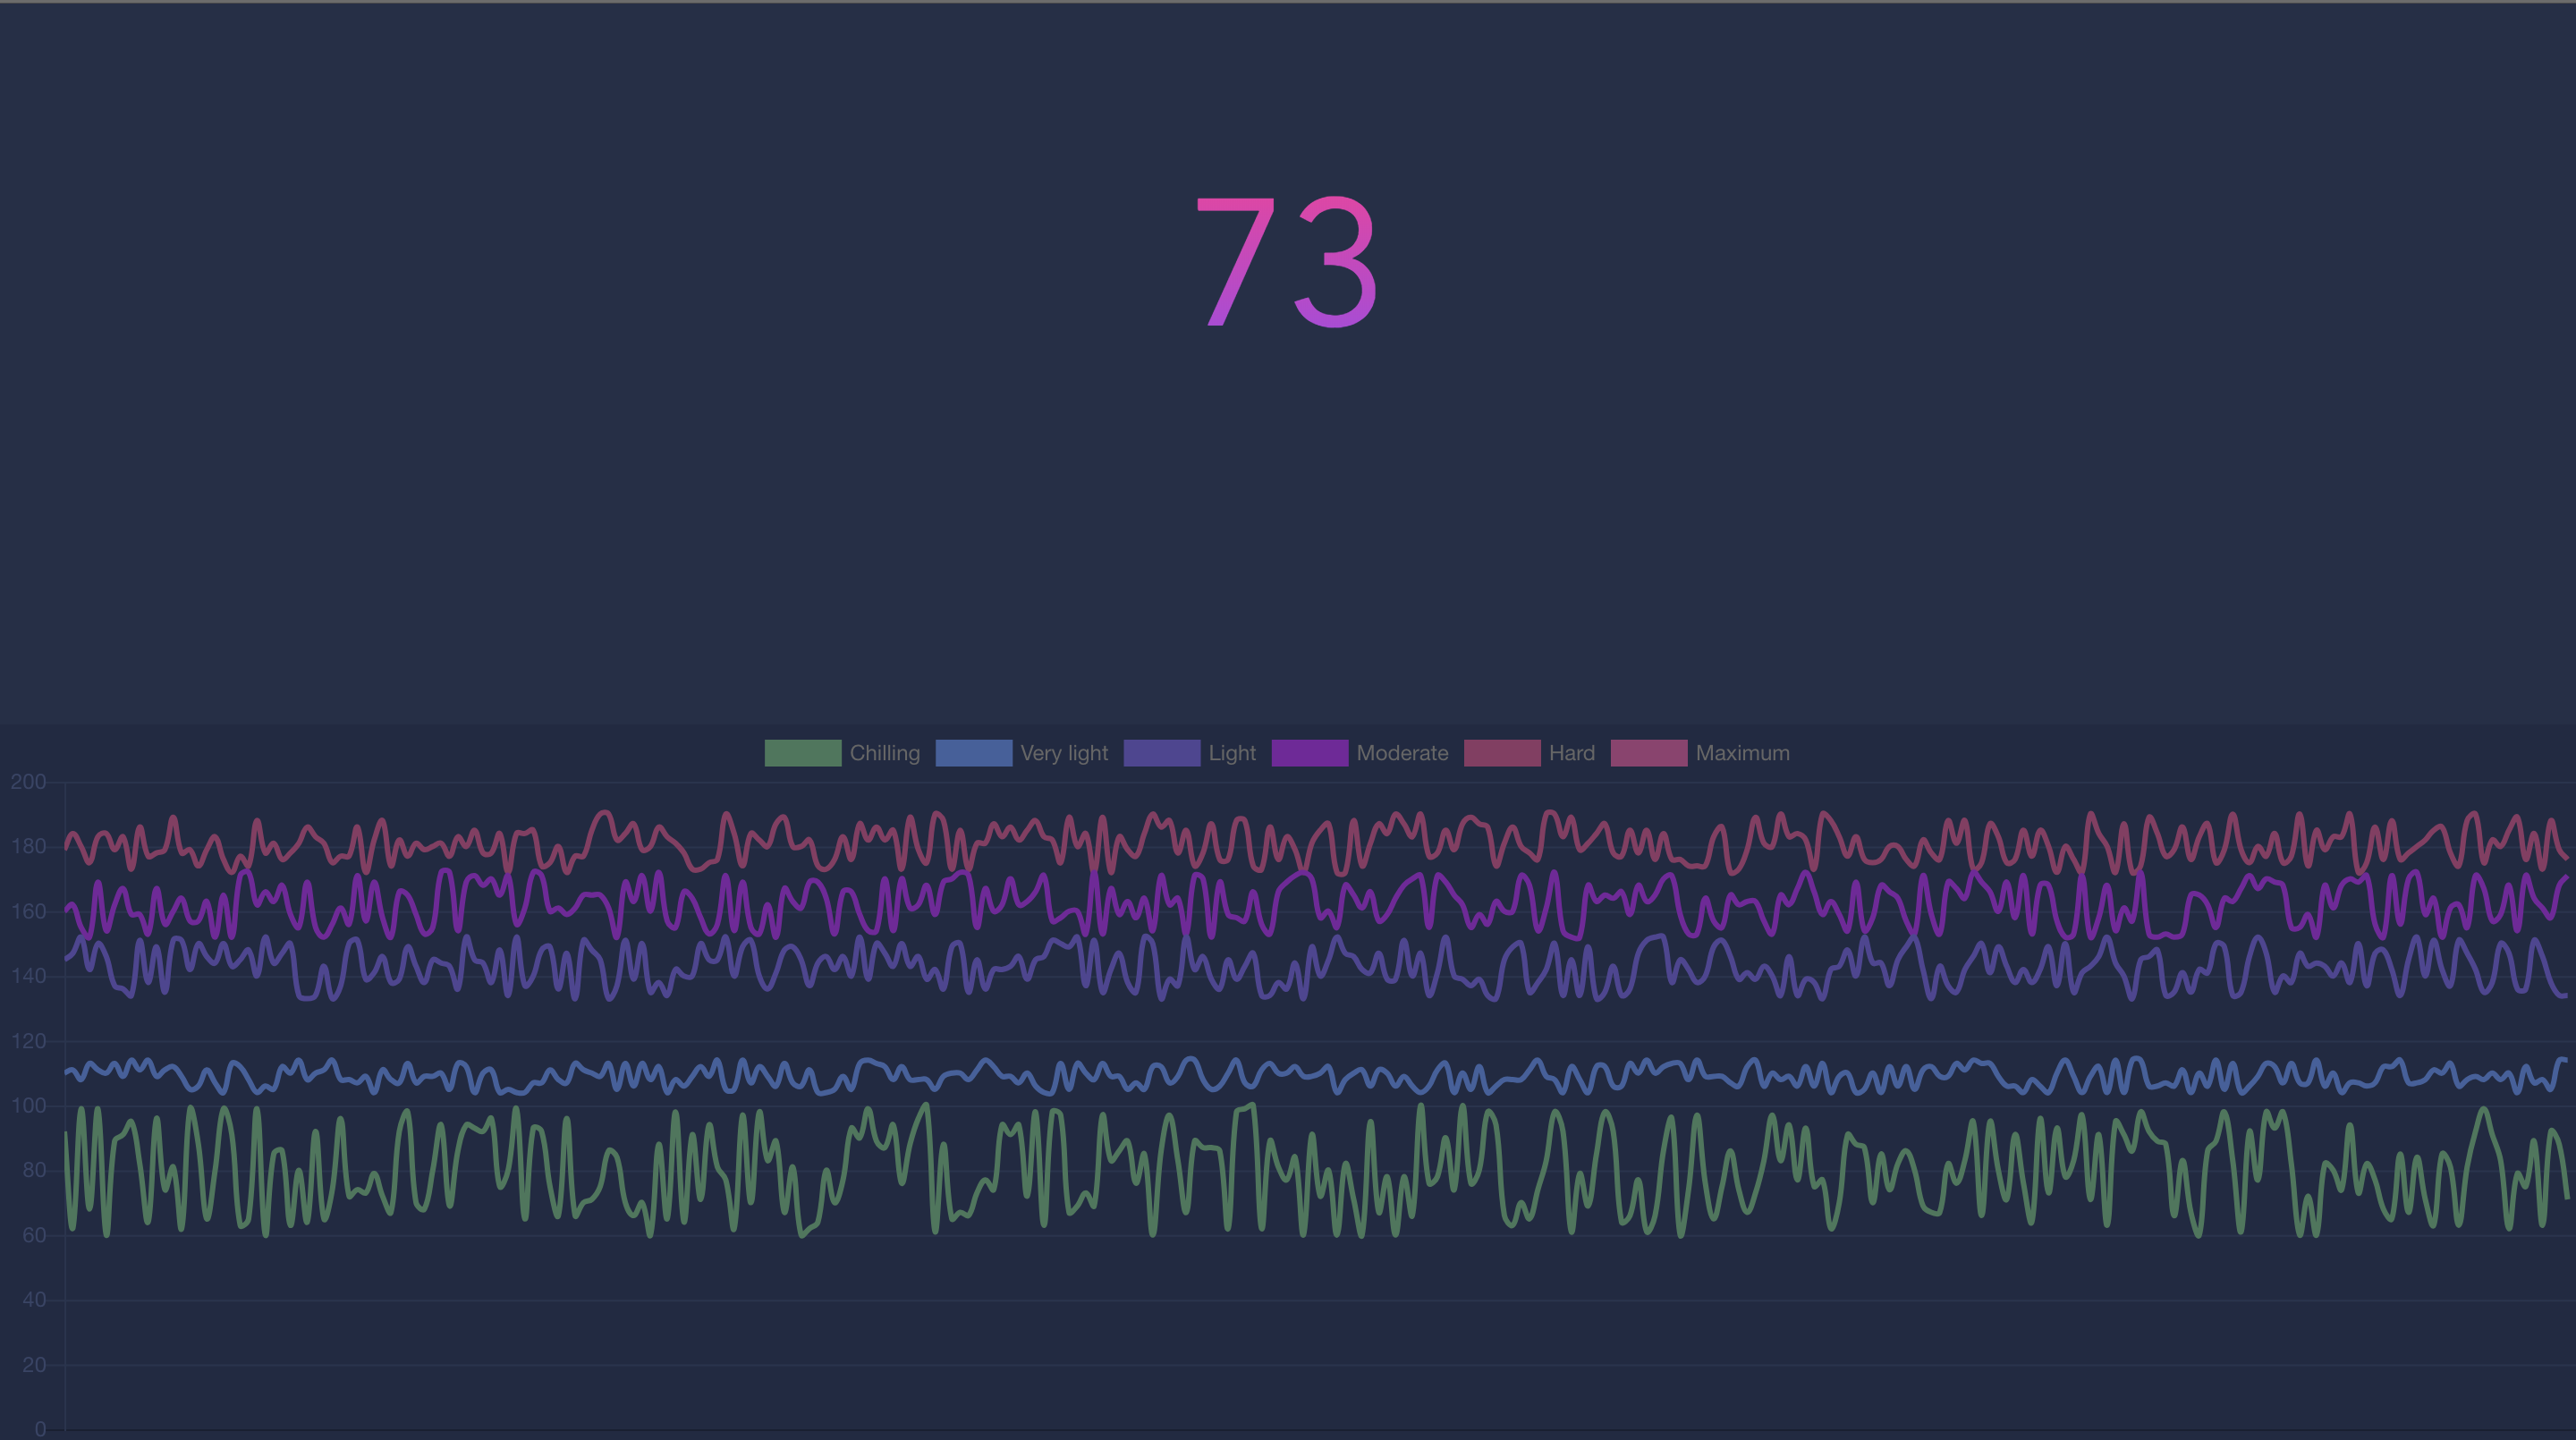
Our application is ready. But, in order not to jump in front of the screen and bring ourselves to the 5th level, let's add a button that will generate random data of all 5 levels for us:
// App.vue <div> <button v-if=!heartRate @click=onClickTest class=blue>Test dataset</button> </div> ... import data from './__mock__/data'; ... onClickTest() { this.heartRateData = [ data(300, 60, 100), data(300, 104, 114), data(300, 133, 152), data(300, 152, 172), data(300, 172, 190), ]; this.heartRate = 73; },
// __mock__/date.js const getRandomIntInclusive = (min, max) => Math.floor(Math.random() * ((Math.floor(max) - Math.ceil(min)) + 1)) + Math.ceil(min); export default (count, from, to) => { const array = []; for (let i = 0; i < count; i += 1) { array.push({ y: getRandomIntInclusive(from, to), x: i }); } return array; };
Result:
findings
Using the Web Bluetooth API is very simple. There are moments with the need to read data using bitwise operators, but this is a specific area. Of the minuses of course is support. At the moment it is only chrome, and chrome on mobile phones and only on android.

Github source
Demo