Recently, among the accessories for bicycles, so-called digital cycle speedometers (cycle computers) have become widespread. These devices are capable of measuring many parameters, the main ones being speed and distance. The principle of speed measurement is based on the calculation of the period of rotation of the wheel, and the distance is calculated based on the measurement of the number of such revolutions. Often the sensor wheel wheel serves as a reed switch in conjunction with a magnet on the spoke wheel. Depending on the functionality, the price of such devices varies widely. The cheapest cycling speedometer can be purchased for about 500 rubles.
I have always had the desire to have such a device. At the same time, I formulated a number of my own requirements, which it should satisfy. First of all, I really wanted to see a graph of speed changes depending on distance or time accumulated over a short period as it moved on the display. And also, record (log) measurements on a storage device for further transfer of statistical data to a computer, their more detailed viewing. Cheap models do not fully meet my requirements, but I do not want to overpay for expensive models.
Based on the foregoing, I decided to create my own cycle speedometer based on the ATmega8 microcontroller. There were many questions, in particular about the used periphery. I stumbled upon articles about using the display from the once popular Nokia 3310 mobile phone. After reading the datasheet on it and making sure of its simplicity of control, I had no doubt that the cycling speedometer would be made in the case of the above-mentioned phone with its own display. The case is pretty good, and the device itself is not difficult to find.

As a ROM for recording measurement statistics, I decided to install a classic 24XX512 ROM (512 Kbps), which is controlled via the I2C interface. I did not bother with the use of an SD / MMC memory card. Another important function in the device is the clock. They are used to bind some of the measured specific parameters (for example, maximum speed) to the date and time, as well as, are needed to record time stamps in the statistics. As a clock, I used a real-time clock (RTC) chip separate from the microcontroller, which has independent battery power and also communicates with the controller via I2C.
I implemented additional minor requirements in the device functionality at the stage of writing the program. This includes any organizational issues: the number of buttons involved, the location on the display of certain elements, navigation through the interface, and so on. In terms of navigation, I decided in advance not to complicate the program, for example, not to implement the settings menu, in particular, setting the date and time. The clock is set once. The clock “ticks” independently in the RTC chip itself due to 32.768 KHz quartz and a long-lasting battery. Setting the date and time is carried out through the cyclometer's UART interface, which is connected to the computer's COM port with one click. Through the same interface, it was supposed to read the statistics data from the ROM into the computer. For all this, you need to write the appropriate program for the computer. However, as further practice showed, the latter had to be abandoned. First, there was the problem of implementing data reception from the controller to the computer at the stage of writing a computer program. And, what is more significant, the volume of the program for the controller increased. It was much more interesting to place the ROM (in the SMD package of the SOIC-8) on a removable platform commensurate with the SIM-card and use the corresponding free slot of the mobile phone. To do this, it is necessary to manufacture a ROM reader based on the SIM reader using one of the known schemes of the I2C ROM programmer. As it turned out later, this decision did not cause any inconvenience.
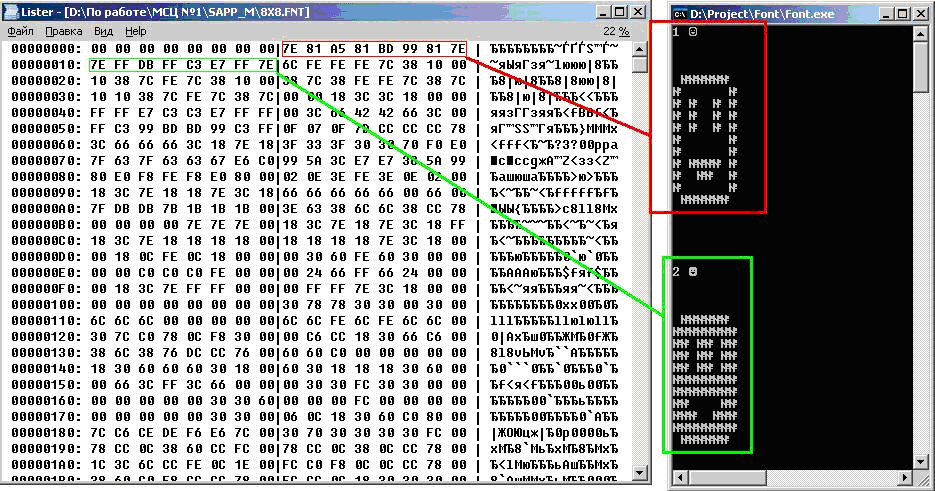
Another important issue is the display of symbolic (including digital) information on a graphic display. This requires graphic information about a particular symbol. This information is closely related to such a parameter as the size of the displayed font. To display the main parameter, the speed of movement, for good clarity, it is desirable to use a large font. However, as will be shown later, such graphic information about ten digits does not fit in the memory of the MC, and the use of the same external more capacious ROM will slow down the font rendering speed. I decided to use a font with a height of 8 points as the largest font. I grabbed the graphic information for this font from a file “8X8.FNT” of a program from MS DOS, having previously guessed its structure and made further processing.
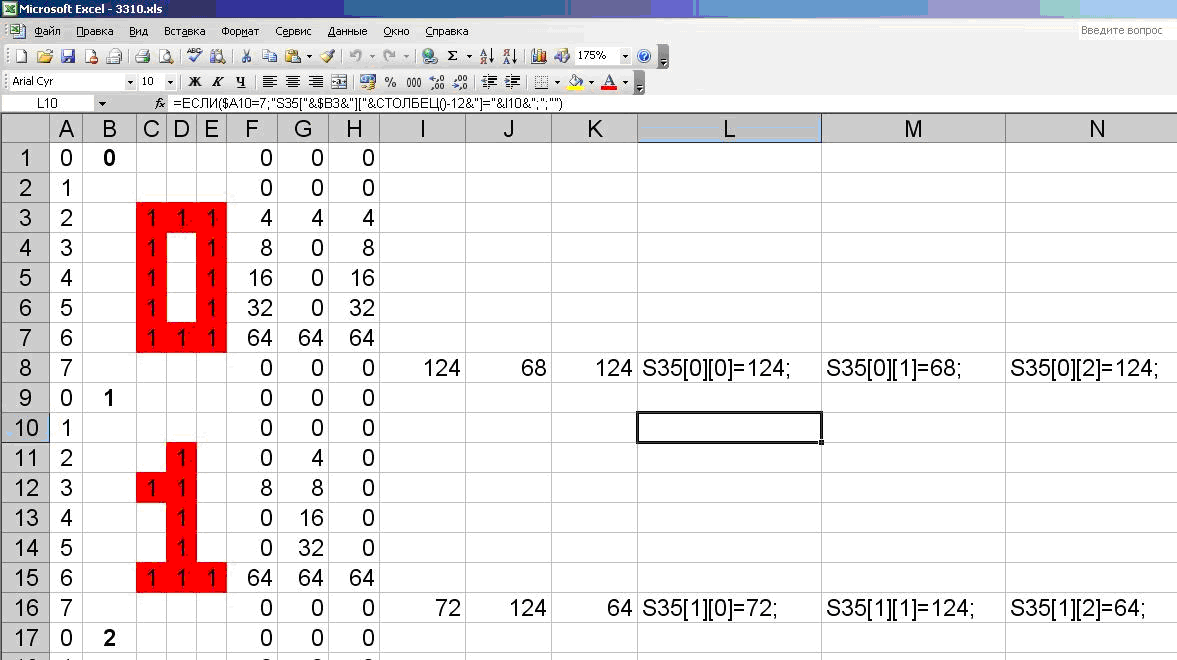
As it turned out later in practice, this size is quite enough for clarity of speed. As a size for an additional font, I chose a size of 3x5 and independently drew graphics for numbers of this size. These small numbers display additional parameters: date / time, average and maximum speed, the way.
Graphic information of both fonts is stored in certain two-dimensional arrays. Each array element, 1 byte in size, designates the pixel distribution of a specific column of a specific digit. For a large font, 8 columns are allocated for each digit, and for small ones - 3. For the same small font, 3X5 in size, the formal height is not 5, but 8 points (rounding to one byte). This allows you to foresee the location of the 5-position font within the 8-position zone in the vertical direction in one of 4 possible ways. These facts are well displayed in the figure below, where the modeling of the graphics for the first two digits of this font is demonstrated. The well-known Excel program is perfect for modeling. The initial data is the arrangement of “one” in the appropriate fields for the required graphics. Of these, the values of the arrays are calculated by formulas, up to the C language code, which can later be copied into the program text for the microcontroller.
Now we will talk about the management features of the display used. This display is monochrome and its size is 84 by 48 pixels. The display is controlled from the MC via the SPI interface. The transmitted bytes on the SPI are interpreted in the display in two modes: bytes for displaying on the display and bytes of configuration commands. These modes are set by the MK on a certain pin of the display (D / C). A complete list of commands is given in datasheet on the display. Some of these commands are used in my device, and are used to initialize the display when power is applied to the device: temperature coefficient, contrast, sequential drawing mode (horizontal or vertical), etc. Immediately, I note that the horizontal drawing mode is used. This means that when transmitting a byte in the display mode, the address is automatically incremented by one row to the right. When a line ends, the position address goes to the beginning of the next line. You only need to send a special positioning command to the display to a specific row and column address (starting position), and then send data bytes one after the other to display the graphs. It is worth noting the feature of the address space and graphics interpretation depending on the bytes received by the display. I note that for monochrome graphics, one byte contains information about eight pixels at once.
The display in question is divided in the vertical direction into 6 horizontal zones with 8 lines each (6 * 8 = 48). Each column of each zone will correspond to a specific byte, which is sent with the address of the corresponding column (0 ... 83) and the zone number (0 ... 5). The address is considered not from one, from scratch. For example, if you position at the address (34; 2) and send data byte 255 (in binary form "11111111"), then all 8 pixels from 16 to 23 will light up vertically and in the 35th column horizontally. This feature, in my opinion, implies one of the drawbacks: the inability to control the state of each pixel separately at the hardware level. Byte is the minimum portion of data for graphics. When transmitting a byte at the current address, all 8 corresponding pixels in the current zone are updated. The display does not support reading the currently displayed graphic information towards the microcontroller. Therefore, if necessary, you need to store the output information in the dedicated buffer in advance in the MC, and to change the state of any pixels (bits), use bit masks for bytes from this buffer and transfer them to the display again.
Modeling and thinking through the location of this or graphical information on the display was carried out taking into account the above features. This was done to simplify the code when writing the program. And it was not by chance that the font size was considered from the category 8, 16, 24, i.e. multiple 8. I also divided the graphic information, by analogy with the display, into 6 horizontal zones. In the first zone, the absolute and the current (since the device was turned on) speed values are displayed in small font. In the second zone, the absolute and current values of the path (in kilometers rounded to hundredths). In the third zone - the average speed. In the fourth - the maximum speed and large print - the current speed. In the fifth zone, two progress bars are displayed for indications of the filling of the ROM and the number of overwrites. In the sixth, last zone, the date and time. It is the fifth zone that is the exception when in the vertical direction of any taken column there are pixels related to different information. Therefore, this information using bit masks is collected in a buffer, the contents of which are then displayed on the display in this fifth zone. Still, in 3-5 zones there is information for drawing a frame around the displayed speed value. In the last zone, each first (lowest) bit on all columns is set to “1” to draw the separator line (40th row). For this simulation and visibility of addresses, I depicted all of the above in Excel cells.
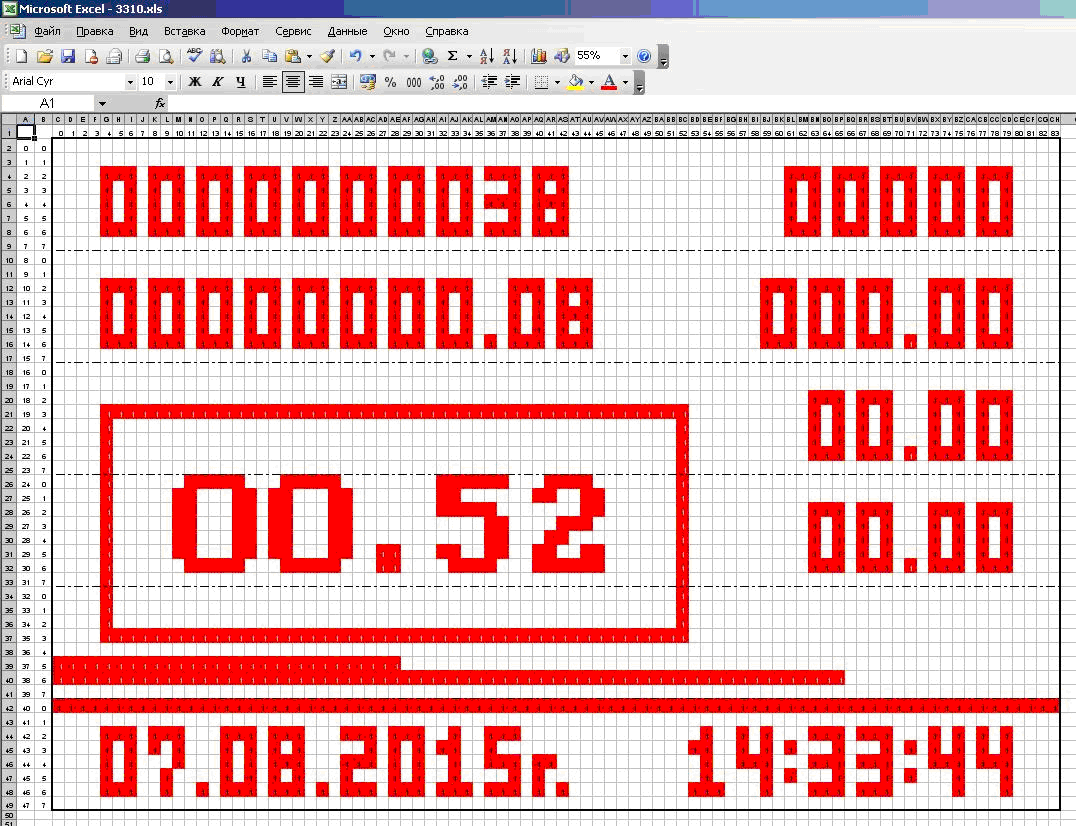
This is how the first display window looks. Just two windows. The second window is a plot of the movement (histogram). For it, there are 5 zones (40 lines) vertically and all 84 columns horizontally. The sixth zone with the clock for both windows is the same.
When programming, I decided not to use any library to work with this display. Personally, I find it easier to understand the datasheet, to implement some of the functions myself, than to understand the library. Moreover, in this there were certain advantages. Recently, after downloading one of the libraries, I still figured out its functional features. It is universal, with its help you can control the pixels individually and positioned to the real address of the pixel. But the library uses a buffer of 84 * 6 bytes in size, and this timer buffer is periodically sent to the display, performing an update of the graphics. Thus, a busy timer and part of the memory MK. In my particular case, there is no need to use the library, since in the course of modeling I took care of the maximum separation of information among the displayed zones, set in full compliance with the display zones. And there is no need to periodically update the information on the display: information is updated only if and only in the place where it changes (with each turn of the wheel, with each press of a button, etc.). Thus, I emphasize once again: depending on the task, it is possible to avoid the use of any libraries.
I also didn’t use libraries to work with clock microcircuits and ROMs: all functions are quite simple and implemented by me after studying datasheets for these components.
Now consider the electrical circuit of the device.
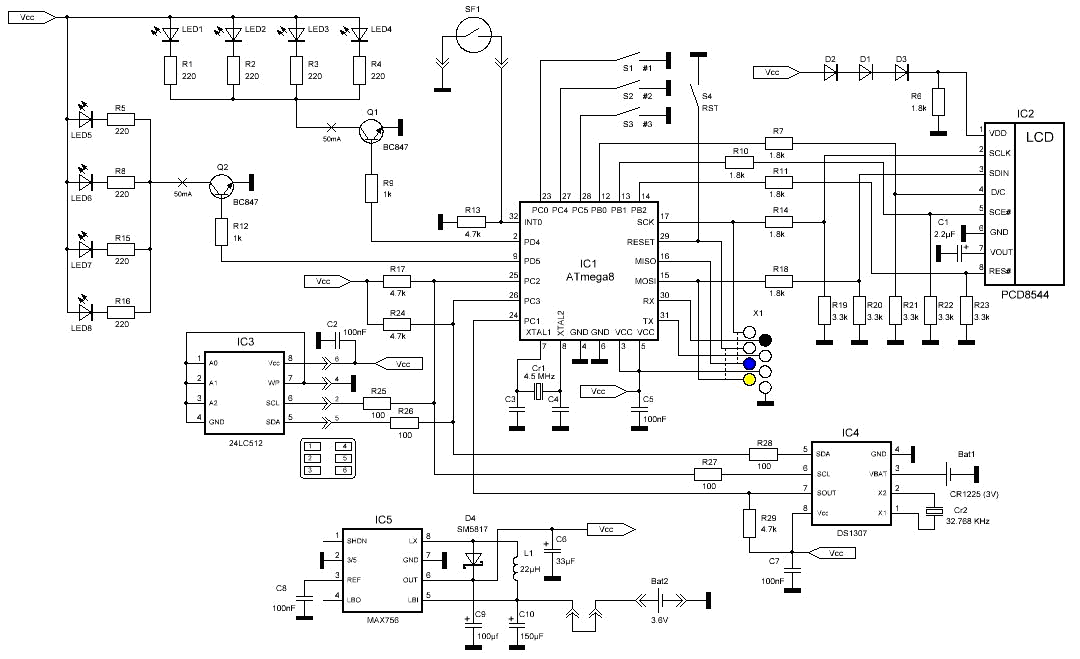
The layout of the cycle speedometer is relatively simple. In addition to all the above, the circuit contains an IC5 MAX756 element that serves as a power converter from 3 to 5 Volts for reliable power supply from the original battery of the Nokia 3310 mobile phone. I didn’t implement the circuit for 3-volt power supply due to lack of the corresponding MK and peripherals. At the current time, I have not yet acquired the MAX756, and the whole scheme is powered by a remote “Kron” battery using the LM7805 regulator (not quite the best option). It connects to the headphone jack on the bottom of the phone. A reed switch SF1 is connected to the port of interruption INT0 MK (pin 32), which is a wheel rotation sensor. It connects securely from the bottom of the phone to the charging connector. Functional buttons S1-S3 are connected to arbitrary ports (pins 23, 27, 28), which coincide with the “1”, “2”, “3” buttons of a mobile phone. A button S4 is connected to the reset pin MK 29, which coincides with the upper end button of the power on of the mobile phone. I did it just like that. The device itself does not have a standby mode and is turned on with the power supply. To the SPI port of the controller (pins 15-17) the display IC2 and the connector for flashing X1 are connected. With the connector that I wanted to make on the basis of the already existing “patches” on the original board for interfacing with a PC (in the same place), there was a small snag, and in the future I will move it to another place. The UART interface is connected to the same connector for a user connection to the computer, through which the date and time on the device are configured (pins 30-31, RX / TX). The display to the controller is connected through dividers on resistors that serve to reduce the voltage, because the display operates at 3.3 V. In addition, the display pins D / C (data / command), SCE (strobe) and RES (display reset) are connected to arbitrary ports MK PB0, PB1 and PB2, respectively (pins 12-14). The display is powered through diodes D1-D3 and resistor R6, which serve to reduce the voltage from 5 to 3.3 V, avoiding the use of a linear regulator. Quartz CR1, clocking MK, with a nominal value of 4.5 MHz was chosen randomly, but deliberately. He just came across my arm, and I decided to use it. To the ports of MK PD4 and PD5 (pins 2 and 9) are connected transistors Q1 and Q2, on which the LEDs of the backlight of the display and keyboard are loaded. The controller provides the ability to control the highlights separately, as the original mobile phone scheme provides (this was at the hardware level, not at the user level), although in practice this is not necessary. The I2C bus is connected to the PC2-PC3 ports (pins 25-26) and, for simplicity, is implemented programmatically using the appropriate library (although it is connected to the hardware TWI ports). The IC3 ROM and the Real Time Clock (RTC) IC4 are suspended on the bus. Immediately make a reservation so that there is no criticism in the comments: I know that DS1307 is not the best solution, but at the time of developing the scheme I did not know about the existence of DS3231. The ROM is located on a removable connector, by analogy with a SIM-card. The additional port of the PC1 controller (pin 24) is used to receive pulses with a frequency of 1 Hz from the RTC, which are used to update the time on the display. All passive dodger components - according to the datasheets for each active component.
Consider the mathematical considerations for the calculation of certain parameters. As already stated at the beginning, the principle of measuring speed is based on the calculation of the period of rotation of the wheel, and the distance is calculated based on the measurement of the number of such turns. The controller measures the time between the previous and the returning impulse from the reed switch. The measurement result is converted to a speed value by dividing the wheel perimeter value by the revolution period, and this value is updated on the display with each pulse (wheel turn). It is worth noting here that, from the point of view of physics, the average speed of the bicycle is calculated on the section of the path corresponding to the perimeter of the wheel. The number of pulses is counted separately, then converted to a distance value. To measure the period of a wheel turn, the controller uses its own timer. The ATmega8 has an 8-bit and 16-bit timer. The length of the timer depends on the dynamic range of the measurement. In my case, a 16-bit timer is used, since 8 bits (256 gradations of the count) are absolutely not enough. The maximum measurement period (before the timer overflows) will correspond to the minimum measured speed. You can enter the so-called program timer, which will measure large periods. However, to simplify the program, I did not do this. With the applied quartz 4.5 MHz and the maximum value of the divider 1024 in the configuration of the timer, we have: (1 / (4500000/1024)) = 0.000227556 sec. This value corresponds to the minimum counting period. And the maximum period of the account will be 0.000227556 * 65536 = 14.913 seconds. The maximum measured speed corresponding to the minimum measured period will be about 30,000 km / h. It was not worth it even to stipulate, the “stock from above” is simply huge. But the minimum measured speed corresponding to the maximum measured period will be 2.26 / 14.913 / 1000 * 3600 = 0.54 km / h.
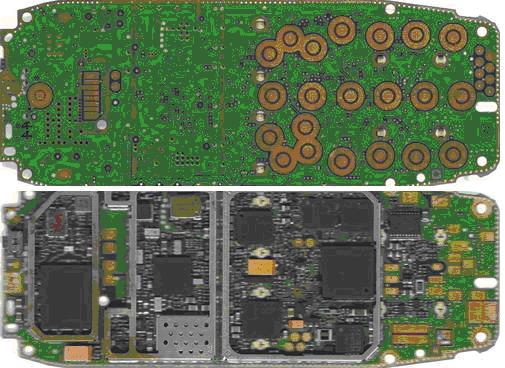
Here 2.26 is the perimeter of the bicycle wheel (in meters) in my case. I am quite satisfied with this minimum measured value. If the bike moves at a speed less than 0.54 km / h, the cycle speedometer will record the absence of movement (and the timer overflow). With this quartz 4.5 MHz UART interface works fine at a speed of 2400 baud with an acceptable acceptable error. This speed is also quite enough, especially since I use the UART for a one-time setting of the clock from the computer (to copy the date and time from the computer to the device). If you take quartz at a frequency higher, the minimum measured speed will increase, which will be unacceptable for me, and it will be necessary to use a software timer. And if you take it lower, the performance of the device as a whole decreases. So I decided to leave this particular quartz.I note that the period and speed values are inversely proportional, and the microcontroller timer measures the period discretely. In our case, the points in the amount of 65535 are uniformly plotted on the measurement range (0.000227556 ... 14.913), dividing it into many equal intervals. And these points correspond to all measured values. Using the conversion of intervals from time to speed, this system of intervals is converted from uniform to inversely proportional. Consequently, the range of all possible measured velocities is divided into non-uniform intervals. The length of these intervals increases with increasing speed value itself. Given this fact, a huge "stock from above", about which I wrote a little higher, will not be superfluous. In practice, it will be quite enough to take the value of 100 km / h for the maximum measured bicycle speed.This is at least in order not to introduce a new digit (hundreds) and not to increase the width of the displayed parameter on the display. Let us calculate what is the length of the interval between neighboring possible values at a speed in the vicinity, for example, 90 km / h. By the inverse formulas or selection it is easy to calculate that for the value of the timer 397 (out of 65536 possible) there corresponds the measured speed of 90.06 km / h. And with a nearby timer value of 398 - 89.83 km / h. And the difference between the speeds - 0.23 km / h, which is already more than acceptable. And at lower speeds, this difference will be even smaller. The display shows the speed value to the nearest hundredth. However, in practice, rounding up to the whole or to the tenth is usually enough. From all this we can conclude: the unevenness of the “grid” of speeds can be neglected,since the measurement error caused by it does not exceed the permissible error.To calculate the distance, it is enough to multiply the number of pulses (revolutions) per wheel perimeter. In this case, of course, the distance is calculated up to the perimeter of the wheel, which is quite acceptable. The current average speed is calculated as the ratio of the current distance traveled to the time value from the moment of switching on. This is the time the controller considers by counting the number of pulses arriving once a second from the RTC. The average speed on the display is updated along with the update time (once per second). All other parameters are updated with each turn of the wheel.Now, regarding the minor features of the interface. The first button is used to switch modes (graphic mode or value display mode). The second button - to display the absolute (for all time) maximum speed instead of relative speed while holding it. Also, the date and time of reaching this speed is displayed in place of the current date and time. And yet, the value of the current address of the ROM is displayed in place of the value of the relative speed (for control). You can estimate this value by horizontal progress bar on the 38th line of the display. This ROM, with a capacity of 65536 bytes (512 kbps), records the measured parameters. As will be said later, it is sufficient to record the initially measured parameter (wheel turning period) with the start time mark.All other parameters are easily calculated by a computer program at the stage of scanning the ROM. The third button is to control the backlight. Unlike the screen sketch above, I subsequently removed the insignificant zeros on the secondary parameters for a more visual display. In the graphical mode, a histogram of the speed of movement is drawn from left to right, which clearly demonstrates the process of changing the speed over a small distance of 84 wheel turns. The value of the histogram - speed in scale of 1 pixel at 1 km / h. If the speed exceeds 40 km / h, the image scale is reduced vertically by 2 times in order to avoid off-scale. Detailed features of the behavior of the device do not need to be described here.I later removed the insignificant zeros on the secondary parameters for a more visual display. In the graphical mode, a histogram of the speed of movement is drawn from left to right, which clearly demonstrates the process of changing the speed over a small distance of 84 wheel turns. The value of the histogram - speed in scale of 1 pixel at 1 km / h. If the speed exceeds 40 km / h, the image scale is reduced vertically by 2 times in order to avoid off-scale. Detailed features of the behavior of the device do not need to be described here.I later removed the insignificant zeros on the secondary parameters for a more visual display. In the graphical mode, a histogram of the speed of movement is drawn from left to right, which clearly demonstrates the process of changing the speed over a small distance of 84 wheel turns. The value of the histogram - speed in scale of 1 pixel at 1 km / h. If the speed exceeds 40 km / h, the image scale is reduced vertically by 2 times in order to avoid off-scale. Detailed features of the behavior of the device do not need to be described here.The value of the histogram - speed in scale of 1 pixel at 1 km / h. If the speed exceeds 40 km / h, the image scale is reduced vertically by 2 times in order to avoid off-scale. Detailed features of the behavior of the device do not need to be described here.The value of the histogram - speed in scale of 1 pixel at 1 km / h. If the speed exceeds 40 km / h, the image scale is reduced vertically by 2 times in order to avoid off-scale. Detailed features of the behavior of the device do not need to be described here.It is worth noting one of the characteristic differences of my cyclometer from cheap purchased ones. It consists in the speed of updating the speed reading on the display. In my device, it is updated immediately, as calculated, with each turn of the wheel. In purchased devices, it is updated with a certain delay. This delay may be due to an attempt to filter measurement noise (for example, using the moving average method) in order to stabilize the speed reading on the display for more detailed visibility. Or perhaps the display is updated completely at regular intervals (for example, twice a second). Maybe this is convenient, but I wanted to implement the update speed with every turn of the wheel.The printed circuit board is made by the LUT method in the form of the original board of the used mobile phone. In the manufacture of the board I used the program "Sayout". At the same time, I made a snapshot of the original board on both sides on the scanner and put the images on the SLayout as a template. This is necessary in order to draw platforms for the connection of the display, buttons and connectors in exclusively the right places. In the manufacture of the board there was an error of about 0.5 mm. This error was acceptable in terms of combining contact pads and elements. However, this error affected the quality of the backlight: the sealed LEDs were shifted a fraction of millimeters and did not fall into the focus of the light-scattering mandrels. Because of this, the brightness of the backlight has decreased, reducing the efficiency.The figures below show the layout of the printed circuit board in the SLayout along with three small printed circuit boards for the ROM in the form of a SIM card. Also, there are scans of the original PCB on both sides.
 Part of the elements (buttons, connectors) are interconnected by thin wired jumpers for lack of opportunity to lay tracks. There is a reserve for all available buttons, i.e., it is possible to use any available button. It may be convenient to make a large button in the center with a button for switching display modes. In the upper left corner of the board is a 3-volt RTC battery. In general, all the elements on the board are placed correctly with the coordination of their dimensions with the dimensions of the case. Unlike the gilded original, the board of its own making is covered with ordinary solder. As shown by the initial practice, contact with the display and other peripherals is not lost.The program for the MC was quite large and occupies a significant part of its memory. In addition, the program provides for the use of its own non-volatile memory controller (EEPROM) to record and save the necessary information. Below is a table of how this information is distributed to EEPROM addresses.
| Address | Size | Data |
| 0 | four | n (for S) |
| four | 2 | t_min (for v_max) |
| 6 | 6 | Date of t_min |
| 12 | 2 | Address EEPROM |
| 14 | one | EEPROM RW Count |
| 128 | 80 | Digits 8X8 |
| 208 | thirty | Digits 3X5 |
The first four bytes save the distance traveled, as the number of revolutions of the wheel. I specifically chose the 32-bit integer type for this variable, since in practice the values of the traversed path are relatively large. For example, an integer 16-bit variable would be able to keep a maximum of 65536 revolutions (about 148 km), which is naturally not enough. This is followed by two bytes to maintain the absolute maximum speed. In fact, the minimum wheel turnover time is maintained. The variable takes two bytes, since its value is the result of measuring a 16-bit timer. The next 6 bytes are the date and time to reach the above maximum speed. The data is presented in exactly the format in which they are read from the RTC chip (excluding the number of the day of the week). Next - two bytes, preserving the value of the current address of the external ROM.This is a kind of pointer, which is necessary for the possibility of continuing to record statistics on the ROM after the next power-up of the device. MK should know at what position the address space of the external ROM, he stopped the last time. From this position, MK will continue recording. This value is allocated 2 bytes, since the address space of the external ROM is 16-bit. This follows from the size of the ROM in 64 KB. Next - a single-byte variable that stores the value of the number of ROM overwrites. Overwriting is considered the case when the above pointer reaches the maximum value and turns to zero. In this case, the newly received information on the ROM will begin to be recorded from the very beginning, erasing the old information available on it. An integer single-byte variable is capable of storing a maximum of 256 values. Remind youthat the values of the ROM address pointer and the number of overwrites are visually indicated by two progress bars on the display. Further, after a large backup space EEPROM MK, starting at address 128, graphical information about the digits of size 8x8 is stored. For it, 80 bytes are allocated (8 bytes for each digit, as mentioned earlier). And, finally, starting at address 208, 30 Bytes are stored for graphical information about small 3x5 digits (three bytes per digit).In addition to the main program for the microcontroller, I have written three more auxiliary programs for the computer, which will be discussed below. All programs do not have a graphical interface and work from the command line of Windows XP.The first program allows you to copy the date and time from the computer to the cyclo-speedometer via the COM port. The cyclo-speedometer is connected to a computer via the MAX232 chip. Using WinAPI, the program gets the current date and time into a special structural variable of the SYSTEMTIME type. The current day, month, year, number of the day of the week, hours, minutes, seconds in a decimal format are extracted from this variable. All these numbers, with the exception of the year, do not exceed two decimal places (less than 100) and lie within one byte. The value of the year is converted to a two-digit number by subtracting from it the number 2000, the value of the current millennium. Each of these two-digit decimal numbers is converted to a binary-decimal format, characteristic of the RTC chip. In this format, a two-digit number also occupies a volume of one byte.The older 4 bits encoded the digit of tens, and the younger ones encoded the digit of units. In the future, a parcel is formed from these numbers, 13 bytes in size, according to the protocol I had previously defined. The first five bytes are the word "TIME =", according to the standard ASCII character set. Then seconds, minutes, hours, day of the week, day, month, year follow. The last byte is the “#” character, as the end of message character. This package is sent from the computer to the device via the COM port. The microcontroller program accepts the parcel and checks it for correctness, according to the above format. If the first five bytes are “TIME =” and the last is “#”, the premise is considered correct, and inside the standing bytes are interpreted in the appropriate order. Without changing this byte chain, the controller sends it to the RTC chip via the I2C bus,configuring it for the current date and time. I note that this microcircuit supports counting the days of the week from 1 to 7, although as such it is not a calendar defining the correspondence of the date and day of the week. Display information on the day of the week in my device, I did not provide.The second program is designed to process data from the contents of an external ROM. Initially it was assumed that this content should be copied from ROM to image file using any known program that works with known MK and ROM programmers (for example, “icprog”). However, having studied in detail the principle of operation of I2C, I managed to implement this functionality and included it in my program. The scheme of the programmer of the ROM of this series, which I used in the device, is shown in the figure below. The ROM is connected to the computer’s COM port, which is used not as a means of exchanging information via RS-232 (where it is enough to use the TX, RX, GND pins), but as a means of random input-output of logical signals. Through the TX pin, the ROM is powered, which is stabilized to 5V by the 78L05 regulator. By controlling the TX output from the computer, we can enable or disable the ROM chip. The unidirectional clocking line SCL is focused on the RTS pin of the COM port socket, and the bi-directional SDA data line is on two pins: CTS (data reception) and DTR (data transfer). Resistors and zener diodes D1 and D2 are used to limit the signal level to TTL, which runs the ROM.I made this standard programmer for my special case, where instead of the panel for the ROM, I used a SIM reader from a broken mobile phone.
 Using WinAPI, the program accesses the computer's COM port pins, sets the values necessary for them (0 or 1), and also removes the incoming binary value from the CTS pin. On the basis of this toolkit, a functionality has been implemented for working with I2C, in accordance with the relevant specification, the details of which I will not go into. The program can read the contents of the ROM into a file-image (as well as a regular programmer), and also process such a file, or process information from the ROM directly. Information processing consists in receiving the output statistics files in a predefined table format based on the input information from the ROM. Each such file corresponds to one trip (from the moment of the current until the next moment the device is turned on). First, I will briefly describe the format of the input data that I predefined.Each time the device is turned on, two bytes of zeros are written at the current address, which is read from the microcontroller's EEPROM. At the beginning of the wheel rotation (at the first impulse) after the timeout or after switching on the device, the current date and time are recorded in a binary-decimal format (as it is stored in the registers of the RTC chip). And afterwards two bytes of “units” 0xFF are written. During rotation of the wheel at each k-th pulse (k = 2,3, ...), the time of the wheel turn between the (k-1) -th and k-th pulse in two bytes (upper and lower) is recorded. Obviously, this information is sufficient to link the current (not absolute) distance traveled and speed to the date and time. The output format is text-based and is a tabulated table in * .csv files that are opened in Excel with a double click of the mouse.The rows in this table correspond to the wheel revolutions, and the column values are given below.
| ADR | |
| DATE/TIME | |
| DEC | |
| time | |
| t | |
| v | Speed |
| n | |
| S | |
| an | ( ) |
| aS | ( ) |
| n_day | |
| S_day | |
| v_max | |
| av_max | ( ) |
| v_mid | |
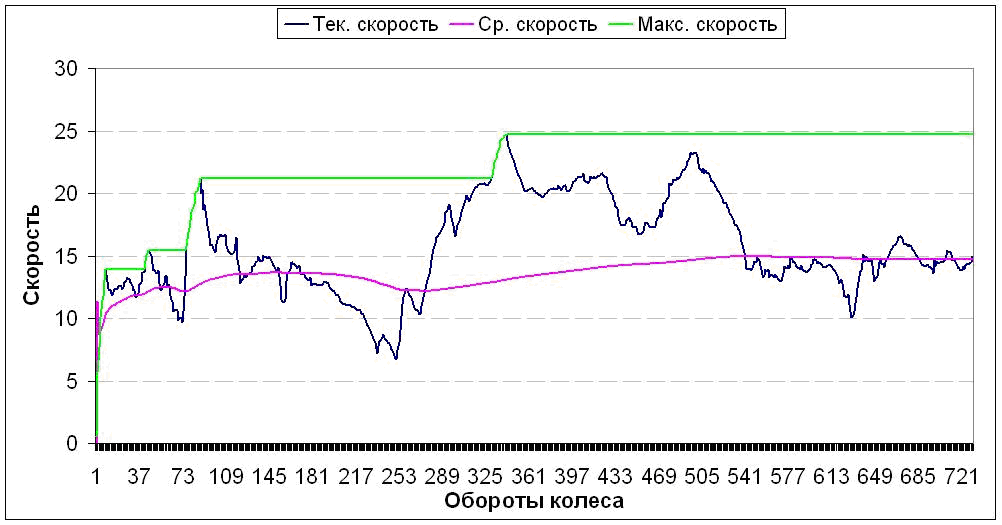
A screenshot of the contents of such a file in Excel is shown in the figure below. Also, graphs of current, average and maximum speeds are shown in different colors in one coordinate system. Argument (X axis) - values of the number of revolutions, as the initial data. The figure shows the changes in the parameters for the first 730 rpm. The distance covered is related to this variable by linear dependence (730 rpm corresponds approximately to 1650 m). Therefore, we can say that the graphs reflect the dependence of speeds on distance (with an accuracy of horizontal scale), in contrast to the traditional dependence of speed on time, to which attention should be paid. As already mentioned, this feature is due to the ideology and the principle of measuring the speed of the wheel speed.But after all, each turn of the wheel (the moment of the magnet and the reed switch approaching) is assigned a specific point in time. Naturally, this sequence of timestamps is not uniform. However, for formality and convenience, Excel has the ability to specify an array of travel time or current time as an argument for graphs. But all the same it should be remembered that the real dependence of speed on time (on uniform time intervals for a discrete case) would look different, with a variable scale horizontally.that the real dependence of speed on time (on uniform time intervals for a discrete case) would look different, with a variable scale horizontally.that the real dependence of speed on time (on uniform time intervals for a discrete case) would look different, with a variable scale horizontally.
 The figure below shows the same speed dependence on speed, but already using a moving average filter with a window width of 11 turns. All graphs are built in Excel using well-known methods.
 Comparing the two graphs of the rate change, it is obvious that the filtered graph does not have a high-frequency component, i.e. removed noise. The width of the moving average window at 11 turns (about 25 m of the way), in my opinion, is too big. If you really raise the question of filtering readings from noise, then it is enough to take a small width of the window, for example, equal to three. This algorithm can be put into the cycling speedometer program, since it can be used not only to analyze the readings, but also to display these readings in real time. Despite the simplicity of this algorithm, I will not go into details of its description, since this topic is covered in the course of mathematics and is beyond the scope of this article. And here is another clarification about the average speed. As I already wrote, average speed is the only parameterwhich is updated not with every turn of the wheel, but every second. I did this so that the display shows a change in the average speed even during very slow motion. Therefore, the values of the readings on the display in real time will differ slightly from the values calculated in the future by a computer program at the ROM scanning stage. The readings of the absolute speed, the absolute path and the absolute maximum speed will also differ. The display shows truly absolute values (for the entire lifetime of the device), and in the output tables - only within the current readable ROM.the values of the readings on the display in real time will slightly differ from the values calculated in the future by a computer program at the stage of scanning the ROM. The readings of the absolute speed, the absolute path and the absolute maximum speed will also differ. The display shows truly absolute values (for the entire lifetime of the device), and in the output tables - only within the current readable ROM.the values of the readings on the display in real time will slightly differ from the values calculated in the future by a computer program at the stage of scanning the ROM. The readings of the absolute speed, the absolute path and the absolute maximum speed will also differ. The display shows truly absolute values (for the entire lifetime of the device), and in the output tables - only within the current readable ROM.The third program, in its essence, is the same program for the microcontroller firmware. I work with the simplest STK 200 programmer connected to the computer’s LPT port, or rather, with its counterpart, if you can call it that, for in the simplest case the programmer does not contain any active elements at all. In fact, the MK via the SPI interface connects to certain pins of the LPT port directly and works as a slave device. The program implements the data exchange protocol with the ATmega8 controller, according to its datasheet (p. 237). The SPI physical layer is implemented by managing the registers of the LPT port using the well-known dynamic library "inpout32.dll". The library is not connecting to me as a project (since I in “Dev-cpp” avoided creating the project as such by creating one simple “shared” file),and using the LoadLibrary function using the HINSTANCE structure type. The “inpout32.dll” library is assigned to a variable of this type, and later pointers to functions from this library are extracted into separate variables. In inpout32.dll there are only two functions that are responsible for data input and output. These functions are accessed according to the signs extracted in advance. The LPT port pins can be controlled separately using bitmasks. In my particular case, the program I wrote works with the EEPROM area of the controller and is intended for reading, backing up, writing, updating and restoring from a backup copy of the data stored in it, which I wrote earlier. Like all other programs, the program runs from the command line. In such cases,to implement the multifunctionality of the program, use the “switch-case” function and a user-defined text dialogue, for example, “enter '1' for operation 1, ..., enter '0' to exit the program”. The data is displayed in various formats convenient for me. In addition to the above, the program can output a full dump of the EEPROM of the controller to 512 Bytes on the screen. Also, the program can write to the controller memory graphic information about the fonts used. In the case of a small font, size 3X5, the program takes information from the text file "Fonts 3X5.txt", which is located in the same directory with it. The file contains a tabulated table of 30 bytes (3 to 10), written in hexadecimal format. If desired, it can be easily edited in a text editor, thus changing the graphics of this font. As already statedThis small font is so simple that it does not make sense to change its graphics. The only thing that can be required is its vertical shift, since there is a space reserve of 8 pixels in height, and the font has a height of 5. In the case of a large font, 8X8 in size, which displays the current speed, I provided a much more interesting functionality. Graphic information about this font is presented not in a text file in the form of a byte table, but in graphical visual BMP files. Each digit corresponds to one such file. Its parameters are 8X8, monochrome with a black and white palette. Below is a screenshot of the famous graphic editor “MS Paint” with the “8.bmp” file opened in it.since there is a space reserve with a height of 8 pixels, and the font has a height of 5. In the case of a large font, 8X8 in size, which displays the current speed, I provided a much more interesting functionality. Graphic information about this font is presented not in a text file in the form of a byte table, but in graphical visual BMP files. Each digit corresponds to one such file. Its parameters are 8X8, monochrome with a black and white palette. Below is a screenshot of the famous graphic editor “MS Paint” with the “8.bmp” file opened in it.since there is a space reserve with a height of 8 pixels, and the font has a height of 5. In the case of a large font, 8X8 in size, which displays the current speed, I provided a much more interesting functionality. Graphic information about this font is presented not in a text file in the form of a byte table, but in graphical visual BMP files. Each digit corresponds to one such file. Its parameters are 8X8, monochrome with a black and white palette. Below is a screenshot of the famous graphic editor “MS Paint” with the “8.bmp” file opened in it.and in graphic visual BMP files. Each digit corresponds to one such file. Its parameters are 8X8, monochrome with a black and white palette. Below is a screenshot of the famous graphic editor “MS Paint” with the “8.bmp” file opened in it.and in graphic visual BMP files. Each digit corresponds to one such file. Its parameters are 8X8, monochrome with a black and white palette. Below is a screenshot of the famous graphic editor “MS Paint” with the “8.bmp” file opened in it.
 Empirically, I studied the structure of monochrome BMP files obtained from MS Paint, and on this basis I was able to learn how to read each pixel of monochrome BMP images (excluding the use of structures and supporting libraries). At the stage of line-by-line horizontal reading from the bottom up (this is how the BMP file structure is organized), the program converts the information into a vertical format characteristic of the display used. This operation is performed in a single pass, where bit masks and the accumulation of variable values are applied. Below I will show this section of code for the i-th digit, drawing attention to the simplicity of the process.
for(k=0; k<8; k++){ fnt[i][k] = 0; } for(j=0; j<8; j++){ fseek(f, 62+4*j, SEEK_SET); byte = ~fgetc(f); for(k=0; k<8; k++){ if(byte & pow2(7-k)){ fnt[i][k] += pow2(7-j); } } }
In the first cycle, the elements of the fnt array are initialized with zeros. Further, each k-th element of this array (k = 0 ... 7) for the i-th digit (i = 0 ... 9) will carry graphic information about each corresponding column of each corresponding digit. The next cycle is a run along the lines of a BMP image file. Operator fseek we are positioned by byte at offset 62 + 4 * j of a predefined BMP file f. The specificity of the formula by which the offset is calculated depending on the line number j is determined by the structure of the BMP file. In the intermediate variable byte, we get the value of the byte by the above offset. This byte stores information about all eight pixels of a monochrome image in the current line j. Operator '~' occurs bitwise byte inversion, which leads to color inversion of each pixel. This is due to the fact that the black pixel in the palette of a monochrome BMP file corresponds to a logical "0", and the white one corresponds to a "1". In the same display used - the opposite is true. In a nested loop, a bit-byte analysis of the byte occurs and, at the same time, the accumulation of information in the fnt output array. The pow2 function is the construction of a two in a non-negative integer degree, written independently. Instead of this function, you can use the more efficient bit-shift operator “<<”, but at the time of writing this program I did not use it.
In addition, the program provides the ability to record in memory MK one of several graphic versions of the font of my choice. These options are implemented using directories (folders) with the name of the form “v1”, “v2”, “v3”, etc., which are located in the “Fonts 8X8” folder in the same directory as the program. And already in these folders are the necessary BMP files. Due to the above described functionality, it is possible to edit or draw numbers from a “clean slate” in the graphical editor, saving and distributing them into directories. I have three font options. The first option is the original one. The second one is the same as the original, but with a zero crossed out and a modified unit (without the underscore). The third is a font with a rectangular edging.
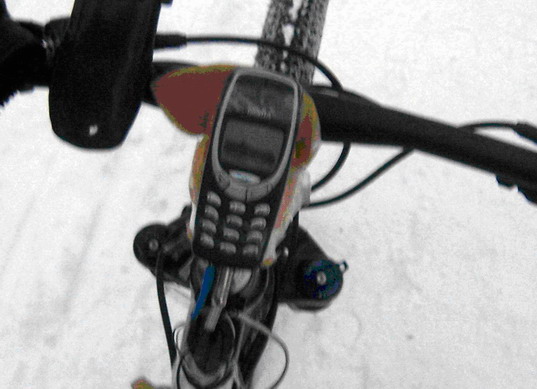
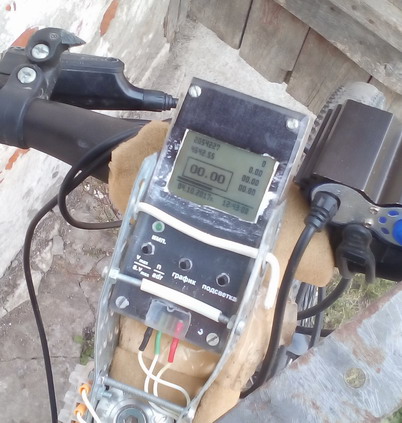
The photos below show: the printed circuit board of the device is on the back side; the device on the table with the power connected to it (with a non-final version of the firmware); a device in operation, mounted on a bicycle, with a chart showing the change in speed.


During the operation of the device, some minor flaws were found associated with the features of manufacturing. First of all, poor display contact with the pads of the printed circuit board. In the original mobile phone the contacts on the board are gold-plated and there is no oxidation. In my case, they are just tinned.
Based on the foregoing, it was decided to redo the device in another case, as well as redo the printed circuit board, on which the display will be soldered insolently. I started this process quite recently. The result was a more robust design.


I made the case for the device from a piece of plexiglass, 17 mm thick, on a CNC milling machine. To do this, I pre-sketched the hull sketches in the SPlan program, almost completely not owning the subject of drawings, CAD, etc.
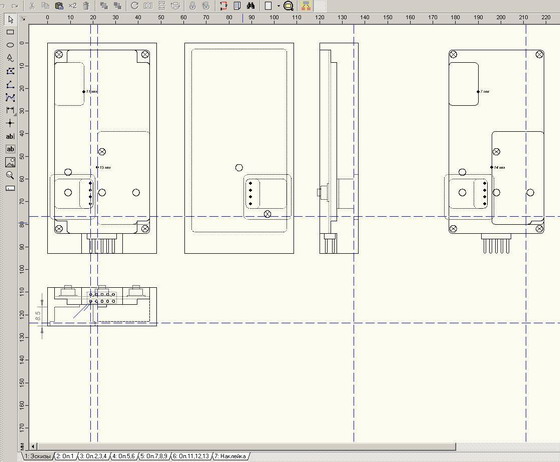
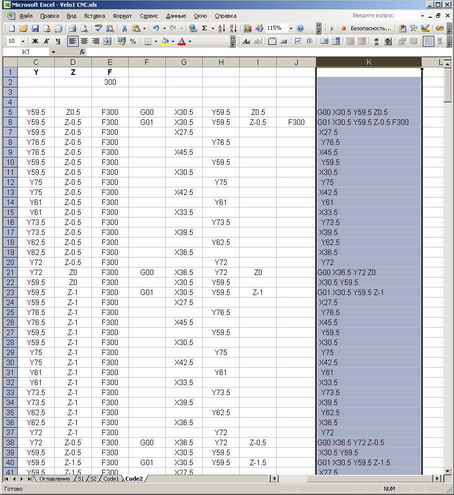
These sketches are needed for a general presentation and to obtain the coordinates of reference points. On their basis, the program is written on the CNC machine, taking into account the general principles and sequences of milling. I wrote the NC program manually in Excel, using auto-complete functions for repetitive operations.

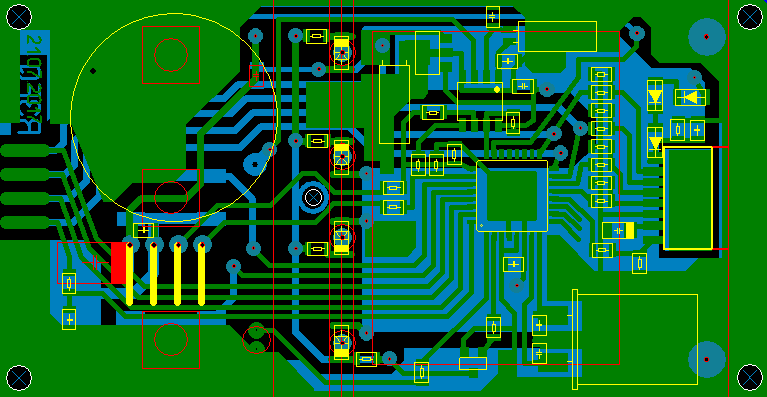
I also slightly corrected the device scheme, it is shown in the figure below.

Instead of the unnecessary backlighting of the keyboard, there is only one LED for beauty, which flashes with every turn of the wheel. The connectors are also redrawn, and there are no other elements that were not needed in the updated version of the design. Later I found and set 4.433619 MHz quartz, slightly correcting some of the constants in the source code of my own program. There have also been a few minor changes in the program.
Photo of the finished product is presented below. The device is powered by the battery, which is on board the bike. From it is also powered lighting in case of travel in the dark.
It was in this performance that the device worked completely without any failures. The only drawback is the use of a not very high-quality RTC chip: in winter, at low temperatures, time is noticeably in a hurry, you have to adjust it once a month.