Streaming replication, which appeared in 2010, has become one of the breakthrough features of PostgreSQL, and at present almost no installation is complete without the use of streaming replication. It is reliable, easy to set up, undemanding to resources. However, with all its positive qualities, its operation can cause various problems and unpleasant situations.
Alexey Lesovsky (
@lesovsky ) on Highload ++ 2017 told how to use the built-in and third-party tools to
diagnose various types of problems and how to fix them . The decoding of this report, built on a spiral principle, is under the cut: first we will list all possible diagnostic tools, then we will proceed to the enumeration of typical problems and their diagnostics, then we will see what emergency measures can be taken, and finally how to cope with the task.
About Speaker : Alexey Lesovsky database administrator at Data Egret. One of Alexey’s favorite topics in PostgreSQL is stream replication and work with statistics, so the report on Highload ++ 2017 was about how to use statistics to look for problems and which methods to use to eliminate them.
Plan
- A bit of theory, or how replication works in PostgreSQL
- Troubleshooting tools or what PostgreSQL and communities have
- Troubleshooting cases:
- problems: their symptoms and diagnosis
- solutions
- measures that need to be taken to avoid these problems.
Why all this? This article will help you better understand streaming replication, learn how to quickly find and fix problems, in order to shorten the response time to unpleasant incidents.
Some theory
PostgreSQL has an entity such as Write-Ahead Log (XLOG) - this is a transaction log.
Almost all changes that occur to the data and metadata within the database are recorded in this log. If a crash occurs, PostgreSQL starts, reads the transaction log and restores the recorded changes to the data. This ensures reliability - one of the most important properties of any DBMS and PostgreSQL as well.
The transaction log can be filled in two ways:
- By default, when backends make some changes in the database (INSERT, UPDATE, DELETE, etc.), all changes are recorded in the transaction log synchronously :
- The client has sent a COMMIT command to validate the data.
- Data is recorded in the transaction log.
- As soon as a commit has occurred, control is given to the backend, and it can continue to accept commands from the client.
- The second option is asynchronous writing to the transaction log when a separate dedicated WAL writer process writes changes to the transaction log at a certain time interval. Due to this, an increase in the performance of the backends is achieved, since there is no need to wait for the COMMIT command to complete.
Most importantly, streaming replication is based on this transaction log. We have several stream replication members:
- master, where all the changes occur;
- several replicas that accept the transaction log from the master and reproduce all of these changes on their local data. This is stream replication.
It is worth remembering that all these transaction logs are stored in the pg_xlog directory in $ DATADIR - the directory with the main database data files. In the 10th version of PostgreSQL, this directory was renamed to pg_wal /, because it is not uncommon for pg_xlog / to take up a lot of space, and developers or administrators, unknowingly confusing it with logs, blithely delete it and it becomes bad.
PostgreSQL has several background services that are involved in streaming replication. Let's look at them from the point of view of the operating system.
- From the side of the master - WAL Sender process. This is the process that sends transaction logs to replicas, for each replica there will be a WAL Sender.
- The replica, in turn, runs the WAL Receiver process, which via the WAL Sender network connection receives transaction logs and sends them to the Startup process.
- Startup process reads the logs and reproduces on the data directory all the changes recorded in the transaction log.
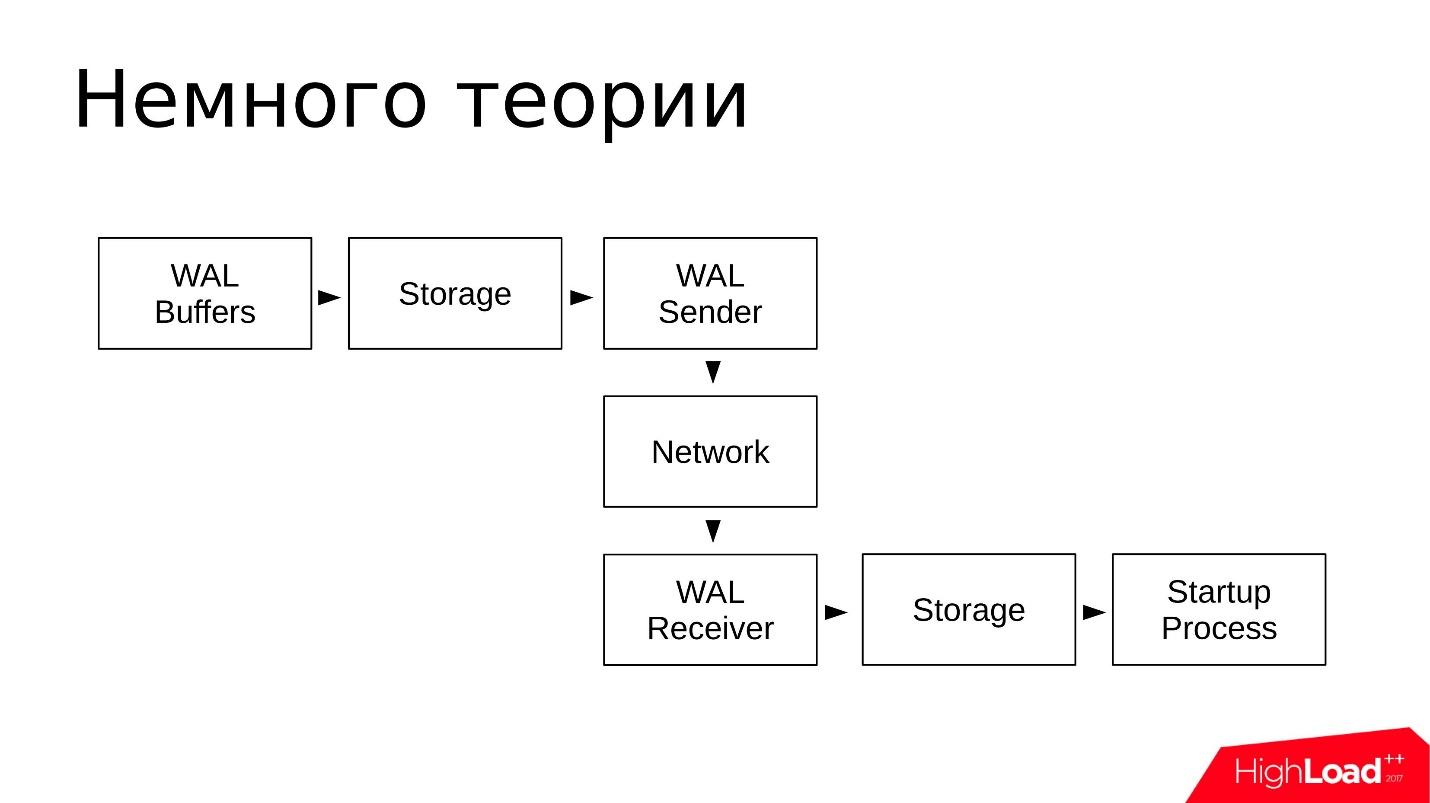
Schematically, it looks like this:
- In WAL Buffers, changes are recorded, which will then be recorded in the transaction log;
- The logs are in the storage in the pg_wal / directory;
- WAL Sender reads the transaction log from the repository and sends them over the network;
- WAL Receiver accepts and stores in its Storage - in its local pg_wal /;
- Startup Process reads everything that is accepted and reproduces.
The scheme is simple. Streaming replication works quite reliably and has been well used for many years.
Troubleshooting tools
Let's see what tools and utilities the community and PostgreSQL offers in order to troubleshoot problems with streaming replication.
Third Party Tools
Let's start with third-party tools. These are quite
universal utilities; they can be used not only when investigating incidents related to streaming replication. These are generally
utilities of any system administrator .
- top from the procps package. As a replacement for top, you can use any utility such as atop, htop, and the like. They offer similar functionality.
With the help of top we look at: processor utilization (CPU), load average (load average) and memory usage and swap space.
- iostat from sysstat and iotop. These utilities show the utilization of disk devices and how I / O is created by processes in the operating system.
With the help of iostat, we look at: storage utilization, how many iops are at the moment, what is the throughput on devices, what are the delays in processing requests for I / O (latency). This rather detailed information is taken from the procfs file system and is presented to the user already in a visual form.
- nicstat is an analogue of iostat, only for network interfaces. In this utility, you can watch the utilization of interfaces.
With the help of nicstat we look: similarly - the utilization of interfaces, some errors that occur on interfaces, bandwidth is also a very useful utility.
- pgCenter is a utility for working only with PostgreSQL. It shows PostgreSQL statistics in a top-like interface, and you can also view statistics related to streaming replication.
With pgCenter we look at: replication statistics. You can watch the replication log, somehow evaluate it, and predict further work.
- perf is a utility for more in-depth investigations into the causes of “underground knocks” when incomprehensible problems occur at the level of PostgreSQL code.
With the help of perf looking for: underground knocks. For perf to work properly with PostgreSQL, the latter must be built with debug symbols, so you can watch the stack of functions in the processes and which functions take up the most CPU time.
All these utilities are needed to
test the hypotheses that arise during troubleshooting - where and what slows down, where and what needs to be fixed, to check. These utilities help ensure that we are on the right path.
Embedded tools
What does PostgreSQL itself offer?
System views
There are a lot of tools to work with PostgreSQL. Each vendor company that provides support for PostgreSQL offers its own tools. But, as a rule, these tools are based on PostgreSQL internal statistics. In this regard, PostgreSQL provides system views (views) in which you can make various selects and get the necessary information. That is, with the help of a regular client, usually psql, we can make requests and see what happens in the statistics.
There are quite a few system views. In order to work with streaming replication and explore problems, we only need: pg_stat_replication, pg_stat_wal_receiver, pg_stat_databases, pg_stat_databases_conflicts, and auxiliary pg_stat_activitu and pg_stat_archiver.
There are not many of them, but this set is enough to check if there are any problems.
Secondary functions
With the help of auxiliary functions, you can take data from statistical system representations and convert them to a more convenient form. Auxiliary functions are also just a few pieces.
- pg_current_wal_lsn () (the old analogue of pg_current_xlog_location ()) is the most useful function that allows you to view the current position in the transaction log. The transaction log is a continuous sequence of data. With this function, you can see the last point, get the position where the transaction log is now stopped.
- pg_last_wal_receive_lsn (), pg_last_xlog_receive_location () is a similar function above, only for replicas. The replica gets the transaction log, and you can see the most recent transaction log item received;
- pg_wal_lsn_diff (), pg_xlog_location_diff () is another useful function. We give it two positions from the transaction log, and it shows diff - the distance between these two points in bytes. This function is always useful for determining the lag between the master and the replicas in bytes.
A complete list of functions can be obtained from the psql meta-command: \ df * (wal | xlog | lsn | location) *.
You can type it in psql and see all the functions that contain wal, xlog, Isn, location. Such functions will be on the order of 20-30, and they also provide various information on the transaction log. I recommend to get acquainted.
Pg_waldump utility
Before version 10.0, it was called pg_xlogdump. The pg_waldump utility is needed when we want to look into the segments of the transaction log, find out which resource records got there, and what PostgreSQL wrote there, that is, for more detailed research.
In version 10.0, all system views, functions, and utilities that included the word xlog were renamed. All entries of the words xlog and location were replaced by the words wal and lsn, respectively. The same was done with the pg_xlog directory which became the pg_wal directory.
The pg_waldump utility simply decodes the contents of the XLOG segments into a human-readable format. You can see which so-called resource records fall into the segment logs during the PostgreSQL process, which indexes and heap files were changed, which information intended for stand-by got there. Thus, a lot of information can be viewed using pg_waldump.
But there is a reservation that is written in the official documentation : pg_waldump may show slightly incorrect data when running PostgreSQL (Can give wrong results when the server is running - whatever that means)
You can use the command:
pg_waldump -f - /wal_10 \ $(psql -qAtX - "select pg_walfile_name(pg_current_wal_lsn())")
This is equivalent to the tail -f command for transaction logs only. This command shows the tail of the transaction log that is happening right now. You can run this command, it will find the last segment with the most recent transaction log entry, connect to it, and start showing the contents of the transaction log. A little tricky team, but, nevertheless, it works. I use it often.
Troubleshooting cases
Here we look at the most frequent problems that arise in the practice of consultants, what symptoms can be and how to diagnose them:
Replication lags are the most common problem . Most recently, we had a correspondence with the customer:
- We have broken master-slave replication between two servers.
- Found 2 hours lag, pg_dump is running.
- OK, I see. What is our allowed lag?
- 16 hours in max_standby_streaming_delay.
- What happens when this lag is exceeded? A siren scream?
- No, transactions will be nailed down, and WAL rolling will resume.
We have problems with replication lags all the time, and almost every week we solve them.
The swelling of the pg_wal / directory where transaction log segments are stored is a problem that occurs less frequently. But in this case it is necessary to take immediate action so that the problem does not turn into an emergency situation when the replicas fall off.
Long queries that are executed on a replica lead to
conflicts during recovery . This is a situation where we put some load on the replica, we can execute read requests on the replicas, and at this moment these requests interfere with the replay of the transaction log. A conflict arises, and PostgreSQL needs to be resolved, to wait for the completion of the request, or to complete it and continue replaying the transaction log. This is a replication conflict or recovery conflict.
Recovery process: 100% CPU usage — The transaction log recovery process on replicas takes 100% of CPU time. This is also a rare situation, but it is rather unpleasant, because leads to an increase in replication lag and is generally difficult to investigate.
Replication lags
Replication lags are when the same query executed on the master and on the replica returns different data. This means that the data are inconsistent between the master and the replicas, and there is some lag. The replica needs to replay part of the transaction logs in order to catch up with the wizard. The main symptom looks like this: there is a query, and they return different results.
How to look for such problems?- There is a basic presentation on the master and on replicas - pg_stat_replication . It shows information on all WAL Sender, that is, on the processes that are involved in sending the transaction log. For each replica there will be a separate line that shows statistics for this particular replica.
- The pg_wal_lsn_diff () helper function allows you to compare different positions in the transaction log and calculate the same lag. With its help, we can get specific numbers and determine where we have a big lag, where a little and already somehow respond to the problem.
- The pg_last_xact_replay_timestamp () function works only on the replica and allows you to see the time when the last lost transaction was performed. There is a well-known now () function that shows the current time, we subtract the time from the now () function, which is shown to us by the pg_last_xact_replay_timestamp () function and get the lag in time.
In version 10 of pg_stat_replication, additional fields appeared that show the time lag already on the master, so this method is already outdated, but, nevertheless, it can be used.
There is a small underwater stone. If there are no transactions on the wizard for a long time and it does not generate transaction logs, then the last function will show an increasing lag. In fact, the system is just idle, there is no activity on it, but in monitoring we can see that the lag is growing. About this underwater stone is worth remembering.
The presentation is as follows.
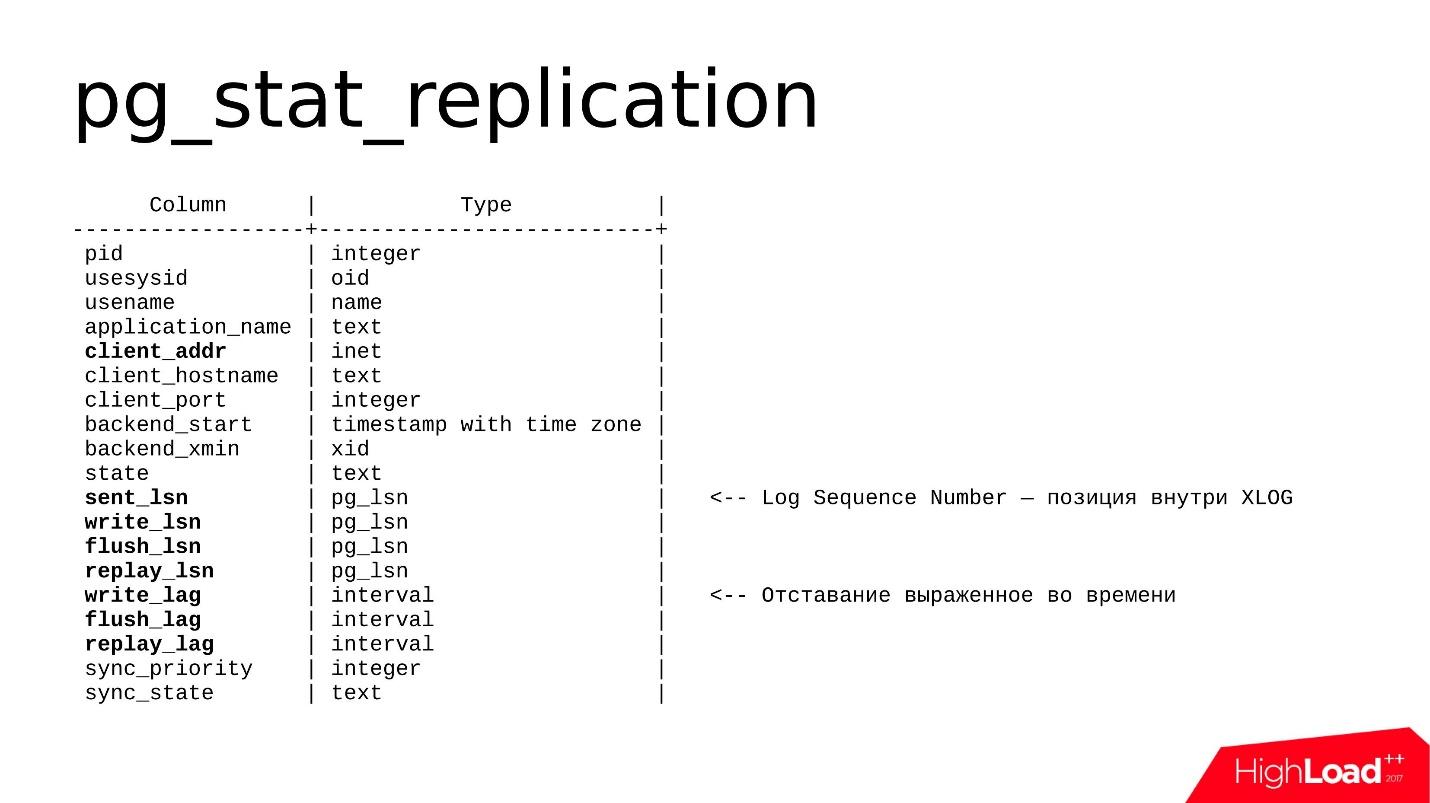
It contains information on each WAL Sender and several fields that are important to us. This is primarily
client_addr - the network address of the connected replica (usually the IP address) and the set of
lsn fields (in old versions it is called location), I will talk about them a little further.
In the 10th version,
lag fields appeared - this is a lag expressed in time, that is, a more human-understandable format. Lag can be expressed either in bytes or in time - you can choose what you like more.
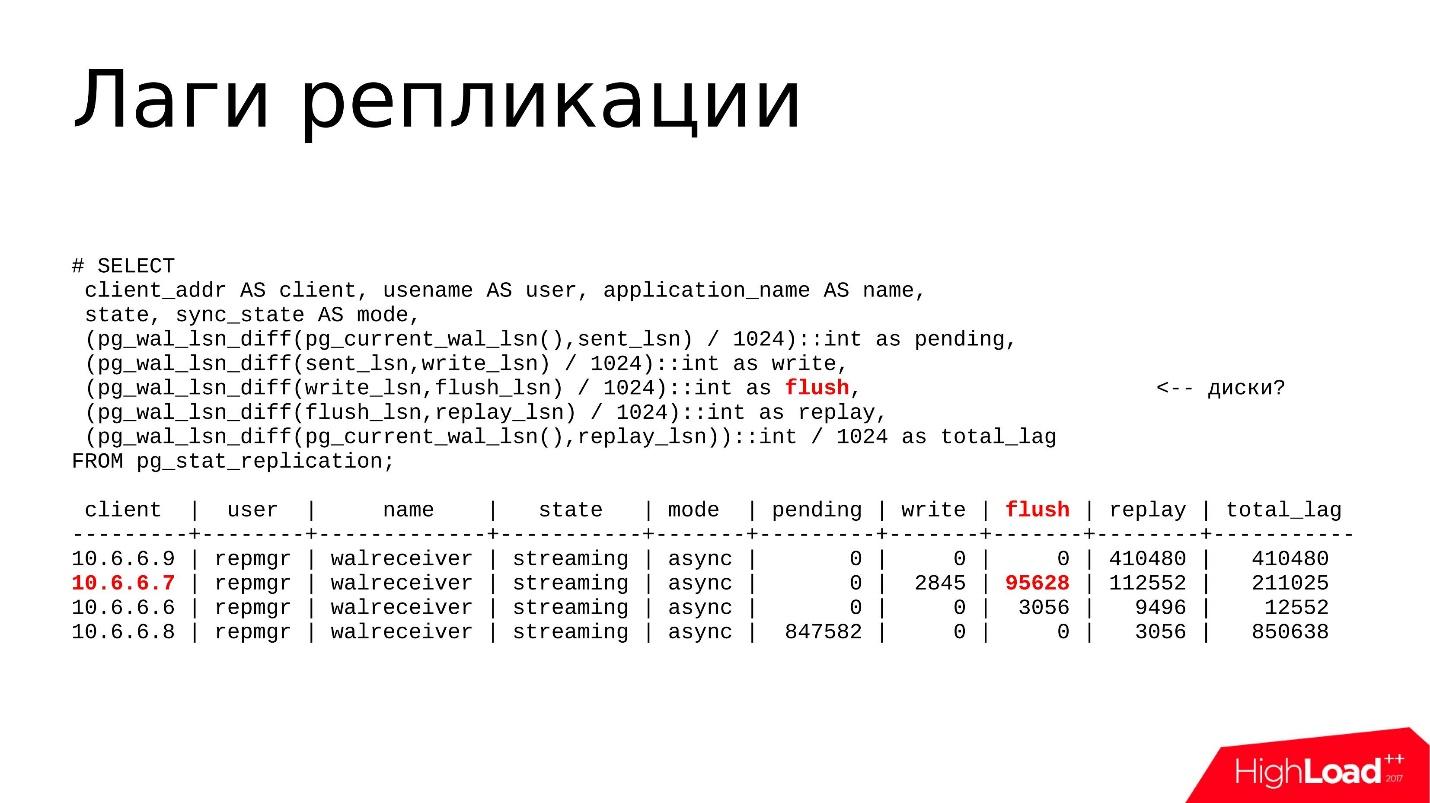
As a rule, I use this request.
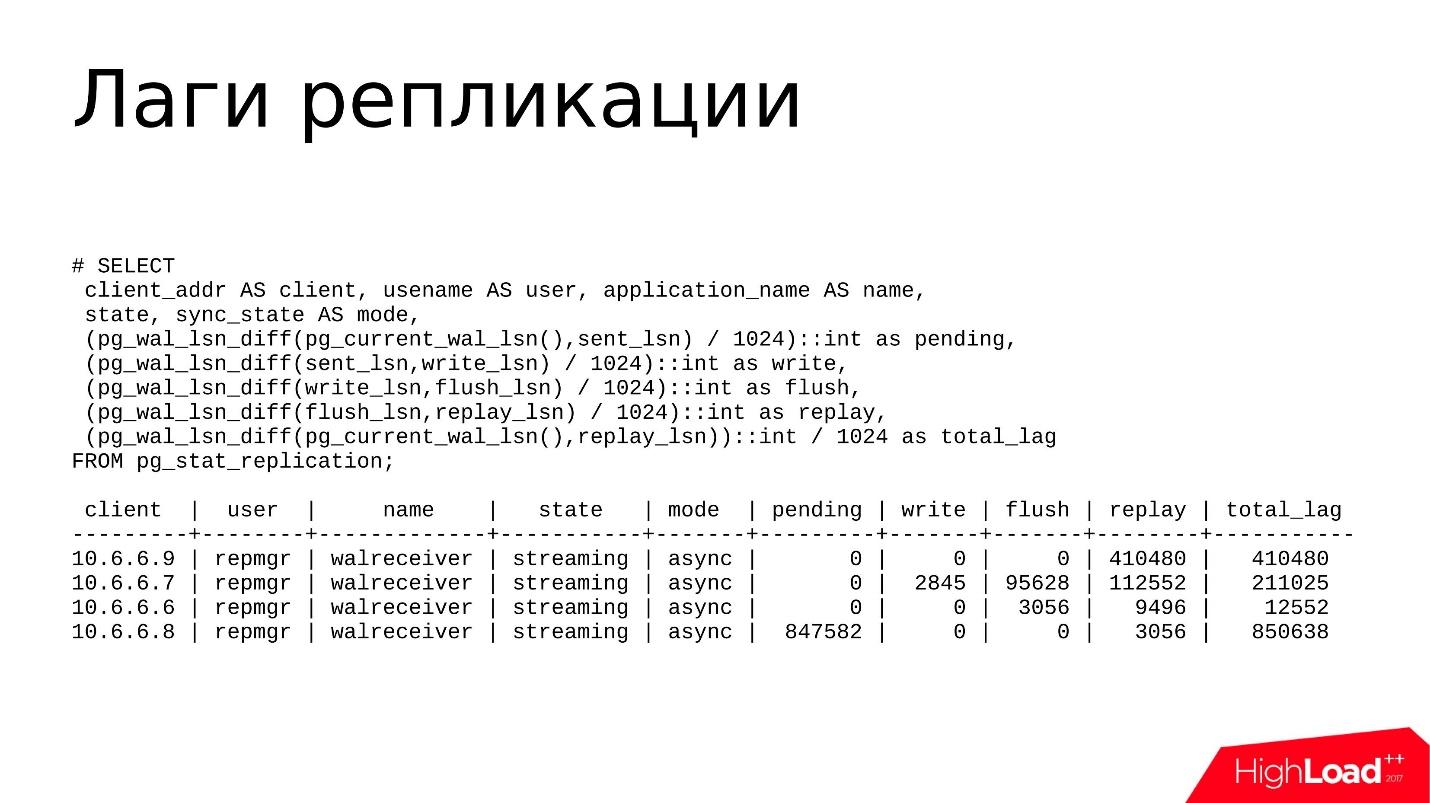
This is not the most complex query, which displays pg_stat_replication in a more convenient, understandable format. Here I use the following functions:
- pg_wal_lsn_diff () to read diffs But between what do I consider diffs? We have several fields - sent_lsn, write_lsn, flush_lsn, replay_lsn. Calculating the diff between the current and the previous field, we can accurately understand where we have a backlog, where exactly the lag occurs.
- pg_current_wal_lsn () , which shows the current position of the transaction log. Here we look at the distance between the current position in the log and the sent one - how many transaction logs are generated, but not sent.
- sent_lsn , write_lsn is how much is sent to the replica, but not written. That is, this is something that is somewhere on the network now, or it was received by a replica, but not yet written from network buffers to disk storage.
- write_lsn, flush_lsn - this is written, but was not released by the fsync command - as if written, but could be somewhere in the RAM, in the page-cache of the operating system. As soon as we do fsync, the data is synchronized with the disk, goes to the persistent storage, and everything seems to be safe.
- replay_lsn, flush_lsn - data reset, fsync executed, but not replicated.
- current_wal_lsn and replay_lsn is a certain total lag, which includes all previous positions.
Few examples

Above, the replica 10.6.6.8 is highlighted. She has a
pending lag , she has generated some transaction logs, but they are still not sent and are on the master. Most likely, there is some problem with network performance. We will check this with the nicstat utility.
We will launch nicstat, we will look at the utilization of interfaces, whether there are any problems and errors. So we can test this hypothesis.
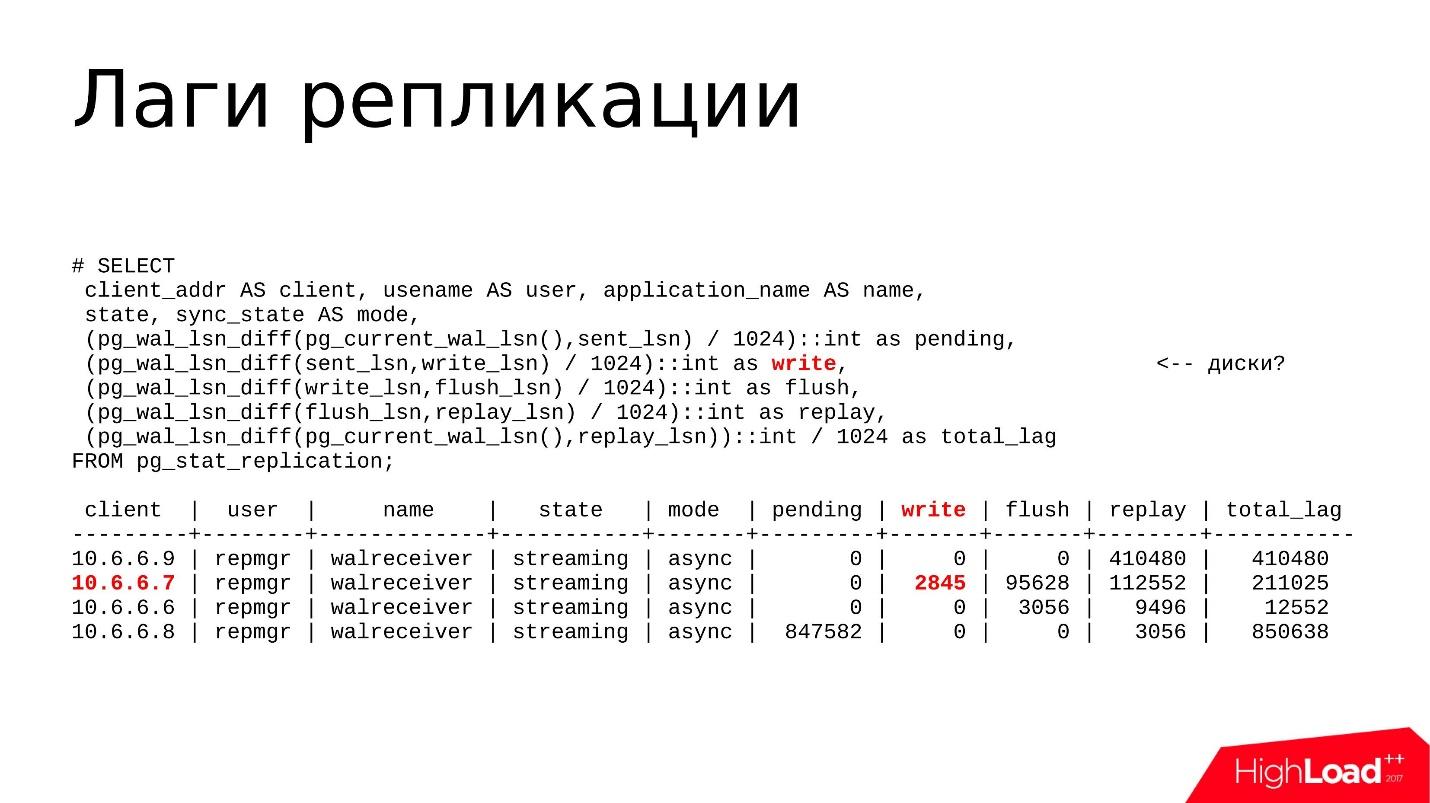
Above marked
write lag . In fact, this lag is quite rare, I almost do not see it large. The problem may be with the disks, and we use the iostat or iotop utility - we look at the utilization of disk storages, what I / O is created by the processes, and then we find out why.
 Flush and replay Lags
 - most often lag happens there, when the disk device on the replica does not have time to just lose all the changes that arrive from the wizard.
We also use iostat and iotop utilities to see what happens with disk utilization and why the brakes.
And the last
total_lag is a useful metric for monitoring systems. If our total_lag threshold is exceeded, a checkbox is raised in the monitoring, and we begin to investigate what is happening there.
Hypothesis testing
Now you need to figure out how to further investigate a particular problem. I have already said that if this is a network lag, then you need to check if we are all right with the network.
Now almost all hosters provide 1 Gb / s or even 10 Gb / s, so
clogged bandwidth is the most unlikely scenario . As a rule, you need to look at the errors. nicstat contains information on errors on the interfaces, you can figure out that there are problems with the drivers, either with the network card itself or with the cables.
We investigate
problems in the repository using iostat and iotop. iostat is needed to view the general picture of disk storage: device utilization, device bandwidth, latency. iotop - for more accurate research, when we need to identify which of the processes loads the disk subsystem. If this is some kind of third-party process, it can be simply detected, completed, and perhaps the problem will disappear.
Recovery delays and replication conflicts are primarily seen through top or pg_stat_activity: which processes are running, which requests are running, the time they are completed, and how long they are running. If these are some long requests, we look at why they work for a long time, shoot them off, understand and
optimize them - we’ll investigate the requests themselves.
If this is a
large amount of transaction logs that is generated by the wizard, we can detect this by
pg_stat_activity . Maybe there some backup processes are running, some vacuums are running (pg_stat_progress_vacuum), or a checkpoint is running. That is, if too much transaction logs are generated, and the replica simply does not have time to process it, at some point it may just fall off, and this will be a problem for us.
And of course
pg_wal_lsn_diff () to determine the lag and determine where we specifically have a lag - on the network, on disks, or on processors.
Solution options
Network / storage problemsIt's pretty simple here, but from a configuration point of view, this is usually not solved. You can tighten some nuts, but in general there are 2 options:
We check what requests are executed. Maybe there are some migrations that generate a lot of transaction logs, or it can be a transfer, delete or insert data.
Any process that generates transaction logs can lead to lagged transactions . All data on the wizard is generated as quickly as possible, we have made changes to the data, sent a replica, and the replica will cope or it will not cope - this is not a concern of the wizard. There may be a lag and need to do something with it.
The most stupid option - perhaps we have rested against the performance of iron, and you just need to change it. These can be old disks or substandard SSDs, or a plug in the performance of the RAID controller. Here we are not exploring the base itself, we are testing the performance of our hardware.
Recovery delaysIf we have any replication conflicts due to long requests, as a result of which the replay lag increases, we
first shoot off the long requests that run on the replica, because they delay the reproduction of transaction logs.
If long queries are related to the non-optimality of the SQL query itself (we find this out with EXPLAIN ANALYZE), you just need to approach the query differently and rewrite it. Or there is the option to configure a
separate replica for reporting requests . If we make some reports that work for a long time, they need to be put on a separate replica.
There is still an option to
just wait . If we have a lag of a few kilobytes or even tens of megabytes, but we think that this is acceptable, we just wait for the request to be fulfilled and the lag itself will be resolved. This is also an option, and it often happens that it is acceptable.
Large WALIf we generate a large volume of transaction logs, we need to reduce this
volume in a unit of time , so that the replica needs to chew less transaction logs.
This is usually done
through configuration . Partial solution in setting full_page_writes = off. This option turns off / off writing full images of changing pages to the transaction log. This means that when we had a service checkpoint write operation (CHECKPOINT), with a subsequent change of some data block in the shared buffers area, the full image of this page will go to the transaction log, and not just the change itself. With all subsequent changes to the same page, only the changes will appear in the transaction log. And so on until the next checkpoint.
After the checkpoint, we record the full image of the page, and this affects the volume of the recorded transaction log. If there are quite a lot of checkpoints per unit of time, let's say 4 checkpoints are done per hour, and too many full page images will be recorded, this will be a problem. You can turn off the recording of full images and this will affect the volume of WAL. But again this is a half measure.
Note: The recommendation to disable full_page_writes should be considered thoughtfully, as the author forgot to specify during the report that disabling a parameter may, under some coincidence, in emergency situations (damage to the file system or its log, partial writing to blocks, etc.) potentially damage the database files. Therefore, be careful, disabling a parameter may increase the risk of data corruption in emergency situations.Another half-measure is to
increase the interval between checkpoints . By default, a checkpoint is done every 5 minutes, and this is quite common. As a rule, this interval is increased to 30–60 minutes - this is quite an acceptable time, during which all dirty pages manage to become synchronized to disk.
But the main solution is, of course, to
look at our workload - which heavy operations are currently going on there, related to data changes, and, perhaps, try to do these change operations in batches.
Suppose we have a table, we want to delete several million records from it. The best option is not to delete these millions at once with one request, but to break them up into packs of 100-200 thousand each, so that, firstly, small amounts of WAL are generated, secondly, vacuum has time to go through the remote data, and therefore the lag was not big and critical.
Swelling pg_wal /
Now, let's talk about how you can find out that the pg_wal / directory has swelled.
The idea is that PostgreSQL always keeps it in the optimal state for itself at the level of certain configuration files, and, as a rule, it should not grow above certain limits.
There is a parameter max_wal_size, which defines the maximum value. Plus there is a parameter wal_keep_segments - an additional number of segments that the master stores for the replica, if suddenly the replica is unavailable for a long time.
By counting the sum of max_wal_size and wal_keep_segments, we can roughly estimate how much space the pg_wal / directory will occupy. If it grows quickly and takes up much more space than the calculated value, it means that there is some kind of problem, and you need to do something about it.
How to detect such problems?
Linux has the
du -csh command . We can simply drive the value into the monitoring and see how many transaction logs we have there; keep the calculated mark, how much it should and how much it actually takes, and somehow respond to the change in numbers.
Another place we look at is the
pg_replication_slots and
pg_stat_archiver views . The most common reasons why pg_wal / takes up a lot of space are forgotten replication slots or broken backups. Other reasons also have a place to be, but in my practice they were very rare.
And, of course, there are always errors in the PostgreSQL logs associated with the archive command. There are no other reasons related to the overflow of pg_wal /. We can only catch archiving there.
Options for problems:
Heavy CRUD - heavy data update operations - heavy INSERT, DELETE, UPDATE, associated with changing several million rows. If PostgreSQL needs to do this, it is clear that a large amount of transaction log will be generated. It will be stored in pg_wal /, and this will increase the space occupied. That is, again, as I said earlier, it is good practice to simply break them up into bundles, and do an update not on the entire array, but on 100, 200, 300 thousand each.
A forgotten or unused replication slot is another common problem. People often use logical replication for some of their tasks: set up buses that send data to Kafka, send data to a third-party application that does logical replication decoding to another format and somehow process it.
Logical replication usually works through slots . It happens that we set up a replication slot, played with the application, realized that this application does not suit us, turned off the application, deleted it,
and the replication slots continue to live .
For each replication slot, PostgreSQL saves transaction log segments in case a remote application or replica connects to that slot again, and then the wizard can send it to them.
But as time goes on, nobody connects to the slot, transaction logs are accumulating, and at some point occupy 90% of the space. We need to find out what is there, why so much space is taken. As a rule, this forgotten and unused slot just needs to be removed, and the problem will be solved. But more about that a little further.
Another option might be a
broken archive_command . When we have some kind of external repository of transaction logs that we keep for disaster recovery tasks, the archive command is usually set up, and pg_receivexlog is less often set up. The command specified in archive_command is very often, either a separate command, or some script that takes the transaction log segments from pg_wal / and copies it to the archive storage.
It happens that some system packages were upgraded, for example, the rsync version changed, the flags were updated or changed, or some other command that was used in the archive command also changed the format - and the script or the program itself is listed in archive_command breaks down. Therefore, archives are no longer copied.
If the archive command has completed with the output not 0, then a message about this is written to the log, and the segment will remain in the pg_wal / directory.
Until we find that our archive team is broken, the segments will accumulate , and the place will also end at some point.
A set of emergency measures (100% used space):1. Shoot off all the long CRUD requests that are currently running on the master - pg_terminate_backend ().These can be some kind of copies of requests, running backups, updates that update a million lines, etc. First of all, we need to kill these requests in order to prevent further growth of the pg_wal / directory so that new segments are not generated.2. Reduce the so-called reserved space for user root files — reserved space ratio (ext filesystems).This refers to the ext file systems and, by default, the ext file system is created with a backup space of 5%. Imagine that you have a file system of several hundred gigabytes, and 5% is quite significant. Therefore, when we see that we have 1% of free space left, we quickly make the tune2fs -m 1 command. The backup space immediately becomes available to the PostgreSQL user and there is time to investigate the problem further. Thus, we have to postpone the 100% occupancy limit for some time.3. Add more places (LVM, ZFS, ...).In the case of using LVM or ZFS, when the administrator reserves a free space in the LVM or ZFS pool, he can allocate free space from this backup pool to where the database is located, and again use the file system command to stretch the file system. With this method, you can urgently respond to the fact that the place ends.4. And most importantly - NEVER, ANYTHING, HE TO REMOVE HANDS FROM pg_wal / .This is what all postgressists say about at all conferences and reports, but people still delete, delete and delete, and the bases break. Never remove anything from there! PostgreSQL itself periodically deletes files from there whenever it sees fit. He has his own functions, his own algorithms, he himself determines when it needs to be done.By the way, pg_xlog / renamed pg_wal / for exactly that reason - the word log confuses administrators, and they think that, probably, there are some unnecessary logs - delete them!What to do next
After we have taken emergency measures and postponed the offensive of 100% filling of the CPU, we can proceed to eliminate the sources of the problems.First you need to check workload and migration . What do we have there that the development team has launched this time? Maybe there they wanted to update some data, download data or something else. And based on this, it is already possible to make an architectural decision: add an additional disk, add a new tablespace, transfer data between the tablespace.Next, check the status of replication . If we have generated a lot of transaction logs, it is likely that a lag could have formed, and if a lag was formed, then it is quite possible that the replica did not have time to chew all the transaction logs and could simply fall off.We need to check the replicas - everything is in order with them.Next you need to check the settings checkpoints_segments / max_wal_size, wal_keep_segments . It is possible that during the configuration of the system, too large values were chosen - 10-20 thousand for wal_keep_segments, or tens of gigabytes for max_wal_size. Maybe it makes sense to revise these settings and reduce them. Then PostgreSQL simply deletes the necessary segments and the pg_wal / directory becomes smaller.You need to check the replication slots through the pg_replication_slots view - are there inactive slots? If they are, then you need to check the subscriber, which should be subscribed to this slot - everything is in order with it. If there is no subscriber, it was deleted long ago, you just need to delete the slot. Then the problem is easily solved.If errors are related to WAL archiving, we can look at these errors in the log, or see the error counter in pg_stat_archiver , there it is. Of course, you need to repair the archive command , find out why it does not work, and archiving does not occur.After all measures, it is advisable to call the checkpoint command . It is in this command that the function of determining which segments of the transaction log are no longer needed by the postgres is sewn up, and it can safely remove them. I emphasize, PostgreSQL itself defines these segments and deletes them itself.Do not delete anything by hand, only through the checkpoint command .Long requests and conflicts during recovery
As I said before, conflicts during recovery, replication conflicts are when a running query on a replica takes a long time. He requested some data and at that moment the change of the same data arrives from the wizard, and replication is in conflict with the request. And it seems that the request needs to be continued, but this data on the replica also needs to be changed.The main symptoms are errors in PostgreSQL or application logs:- User was holding pin for too long.
- This would be possible to remove the link.
- User was holding a lock for too long.
- Might be dropped.
- User transaction caused by bufer deadlock with recovery.
- User was connected to this database.
The first 2 points are the most frequent reasons when the request goes exactly to the data that needs to be updated for replication. The following scenario occurs: there is a parameter that determines the delay that will be counted when a conflict is detected. As soon as this delay exceeds the specified threshold (30 seconds by default), PostgreSQL completes the request and replication continues to recover the data - everything is super.The next problem occurs less frequently. As a rule, it is connected with the fact that replication from the master transfers some information about locks on the master to the replica. If the executing requests somehow conflict with these locks, then the request is also shot off after timeout and this error occurs. This happens on migrations - when we do ALTER, we add indexes to the tables, such an error can occur.The following errors occur even less frequently. They are usually associated with the fact that the tablespace or base is deleted on the wizard, and the query was launched and worked with the data of this base or tablespace. This happens rarely, and usually everyone knows when someone removes the base - I think so.How to detect?
We have views pg_stat_databases, pg_stat_databases_conflicts for detection . In these views, we have information about conflicts, and they need to be monitored. If we have conflicts, we begin to understand further.This really becomes a problem if requests are shot at a replication conflict very often . We believe that requests are very important to our users. Users are starting to suffer, and this is already a problem. Or, when there is a large replication lag due to the fact that the request keeps replication, and this is also a problem.What to do?
There are several options, but all of them - the choice of the least of the evils:- max_standby_streaming_delay ( ). , . .
- hot_stadby_feedback ( /). , vacuum - , . bloat . , , , hot_stadby_feedback .
- DBA — . , . , , , - , .
- , , , , DBA — , , . max_standby_streaming_delay . , . , , , . — , .
Recovery process: 100% CPU usage
It so happens that the process that rolls up the transaction log uses 100% of the resources of a single core . It is single-threaded, sits on only one processor core, and fully utilizes it 100%. As a rule, if you look in pg_stat_replication, you can see that there is a large replay lag, that is, a lot of data needs to be reproduced, and the replica does not have time.We discover this through:- top - this is very quick and easy to check - you just see 100% CPU usage on the recovery process;
- pg_stat_replication - in monitoring, if it is configured, we will quickly see it all.
What and how to search
This is one of the most non-trivial problems, search algorithms are not formed. As a rule, we resort to the use of utilities:- perf top / record / report (debug — packages are required);
- GDB;
- Less often pg_waldump.
You need to see which stack of functions, and where functions spend the most time. A typical example would be workload, associated with creating and deleting temporary or regular tables on the wizard . This happens, and to remove a table, PostgreSQL needs to scan all the existing shared buffers and delete links to this table (very simple). This is quite a laborious operation when replaying the transaction log.Decision
How to solve such problems is also not always obvious and depends on the results of the investigation . Somewhere you can change the workload, fix something, somewhere you need to write a patch to the developers: "I dig in the source code and found that something is not optimal."You can write this on the pgsql-hackers , pgsql-bugs mailing lists , post and wait for the developers to respond. Fortunately, this usually happens quickly.But I repeat once again - unfortunately, there are no guaranteed solutions .Results
Streaming replication problems are always distributed between hosts . This means that the causes of the problems must be searched on several nodes and be prepared for the fact that this is a distributed problem that is not located on a single node.Sources of problems are often user load . I mean that, as a rule, the source of the problems are the requests that the application generates, and less often the equipment.Of course, you need to use monitoring , without it - nowhere. Add the necessary counters that I mentioned in the monitoring, and then the reaction time to the problem will be much less.The built-in tools that I talked about are advisable to know and use. - then the time you spend searching for problems will take much less.useful links
, Highload++ Siberia , 25 26 . , , .
- MySQL ClickHouse.
- , Oracle.
- Nikolay Golov will tell you how to implement transactions, if there is money in one service, services in another, and each service has its own isolated database.
- Yuri Nasretdinov will explain in detail why VK needs ClickHouse, how much data is stored, and much more.