Posted on May 17, 2018Immediately after installing the hive, I thought: “I wonder how to count the number of bees arriving and departing?”
A small study showed: it seems that so far no one has invented a good non-invasive system that solves this problem. But it would probably be useful to have such information to check the health of the hive.
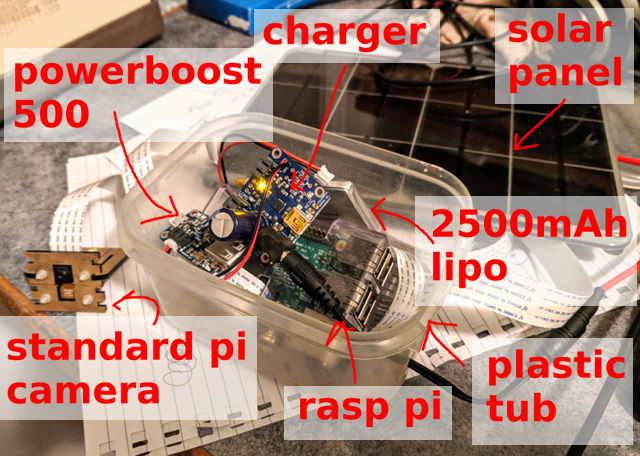
First, you need to collect sample data. Raspberry Pi, standard Pi camera and solar panel: this simple equipment is enough to record one frame every 10 seconds and save 5000+ images per day (from 6 am to 9 pm).
Below is an example of an image ... How many bees can you count?
What exactly is the question?
Secondly, it is necessary to formulate the problem of what exactly a neural network does. If the task is “counting bees in an image”, then you can try to get specific numbers, but this does not seem to be the easiest option, and tracking individual bees between frames does not give any pleasure. Instead, I decided to focus on the location of each bee in the image.
A quick check of the standard frame-by-frame detector did not give any special results. This is not surprising, especially considering the density of the bees around the entrance to the hive (hint: transfer of training does not always work), but this is normal. So, I have a very small image, only one class for object recognition and there are no particular problems with the bounding box itself. Just decide whether to have a bee or not. What solution will be easier?
v1: “bee eat / no” fully convolutional network on a fragment
The first fast experiment was the detector “bee in the picture is / no”. I mean, what is the probability that there is at least one bee in a given image fragment? To do this in the form of a
fully convolutional network on very small fragments of the image means that you can easily process the data in full resolution. The approach seemed to work, but failed for the area of the entrance to the hive with a very high density of bees.
v2: RGB image → black and white raster image
I quickly realized that the task can be reduced to the problem of image transformation. The input is a RGB camera signal, and the output is an image of a single channel where the “white” pixel indicates the center of the bee.
 RGB input (fragment) and single channel output (fragment)
Marking
The third step is marking, that is, the assignment of symbols. It is not too difficult to deploy a small
TkInter application to select /
deselect bees in an image and save the results in a SQLite database. I spent quite a lot of time to properly configure this tool: anyone who manually performed a significant amount of marking will understand me: /
Later we will see, fortunately, that on a large number of samples one can get a pretty good result using semi-automatic methods.
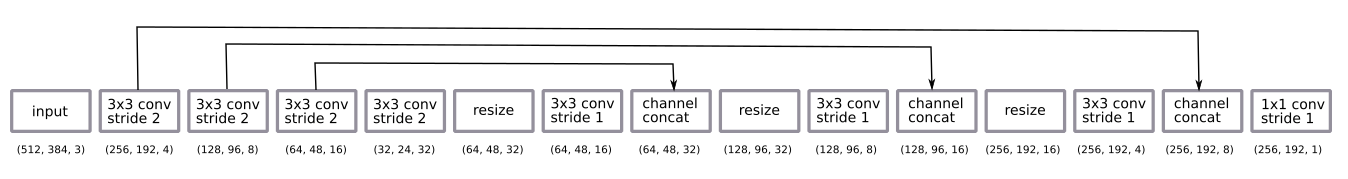
Model
The network architecture is quite standard u-net.
- fully convolutional network is trained on fragments with half resolution, but works on images with full resolution;
- coding is a sequence of four 3 × 3 convolutions in 2 steps
- decoding - a sequence of resizing by the nearest neighbors + minimizing 3 × 3 in increments of 1 + skipping the connection from the encoders;
- the final coagulation layer is 1 × 1 in increments of 1 with the activation of the sigmoid function (that is, the binary choice “bee is / no” for each pixel).
After some empirical experiments, I decided to go back to decoding with half the resolution. He was enough.
I did decoding by resizing my nearest neighbors instead of deconvolution rather out of habit.
The network was trained by the
Adam method and was too small to apply
packet normalization . The design was surprisingly simple, enough for a small number of filters.
I applied the standard data augmentation method, random rotation and color distortion. Training in fragments means that we essentially get the option of randomly slicing the image. I did not turn the image, because the camera always stands on one side of the hive.
There is some nuance in the post-processing of output predictions. With probabilistic output, we get a blurred cloud where bees can be. To convert it into a clear image, one pixel per bee, I added a threshold value, taking into account related components and detecting centroids using
the skimage measure module . All this had to be set manually and adjusted purely to the eye, although theoretically it could be added to the end of the stack as an element of learning. Maybe it makes sense to do this in the future ... :)
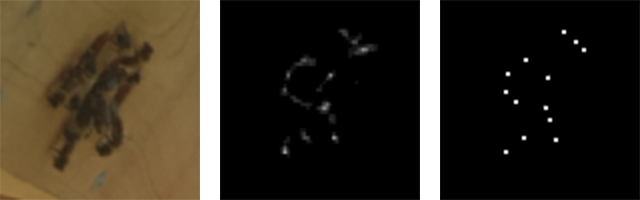 Input, raw output and cluster centroids
Summary of several days
In a day
Initially, experiments were conducted with images for a short period in one day. It turned out to be easy to get a good model on this data with a small number of labeled images (about 30).
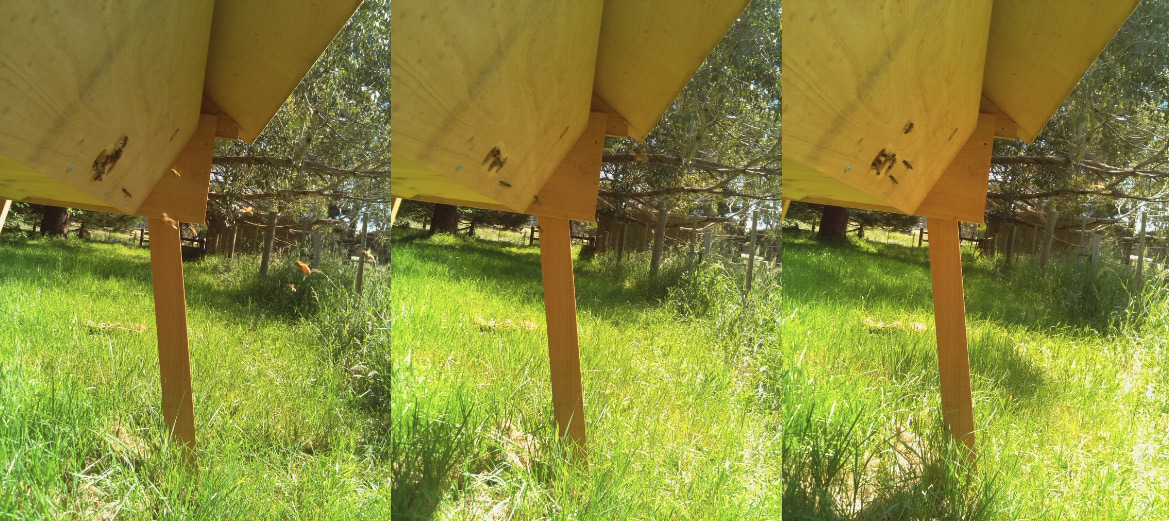 Three samples taken on the first day
For many days
Everything became more difficult when I began to take into account longer periods of several days. One of the key differences is the difference in lighting (time of day and different weather). Another reason is that I installed the camera manually every day, simply by sticking it with adhesive tape. The third and most unexpected difference was that with grass growth, dandelion buds look like bees (that is, in the first round, the trained model did not see the buds, and then they appeared and provided a continuous stream of false positives).
Most of the problems were solved with data augmentation, and not a single problem became critical. In general, the data do not vary much. This is great because it allows us to limit ourselves to a simple neural network and a training scheme.
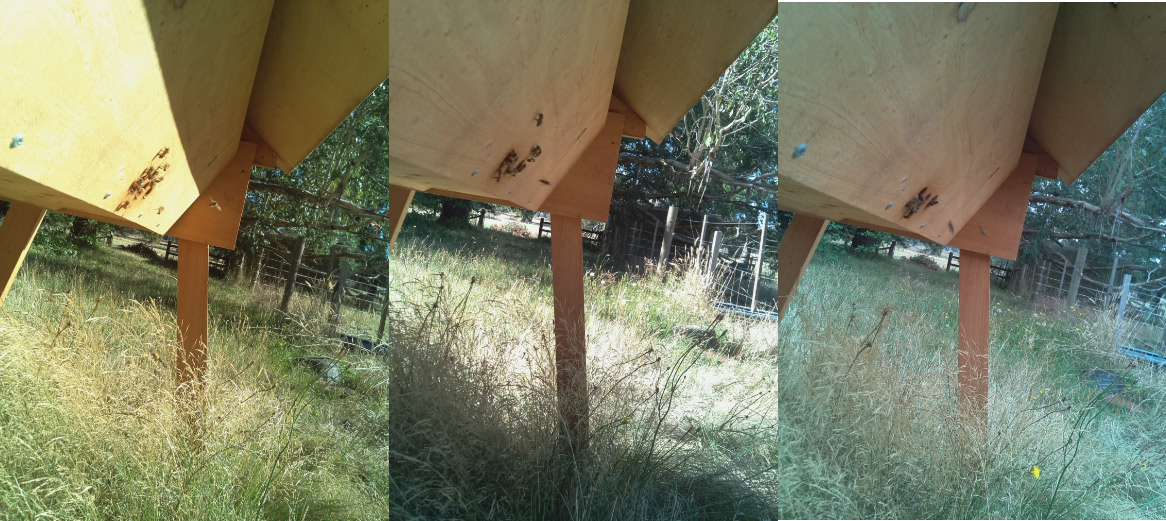 Samples received in three days
Prediction Example
The image shows an example of a forecast. It is interesting to note that there are a lot more bees here than on any image that I manually marked. This is an excellent confirmation that the full convolutional approach with learning on small fragments really works.

The network works fine in a wide range of options. I suppose a monotonous background helps here, and launching the network on some arbitrary hive will not give such a good result.
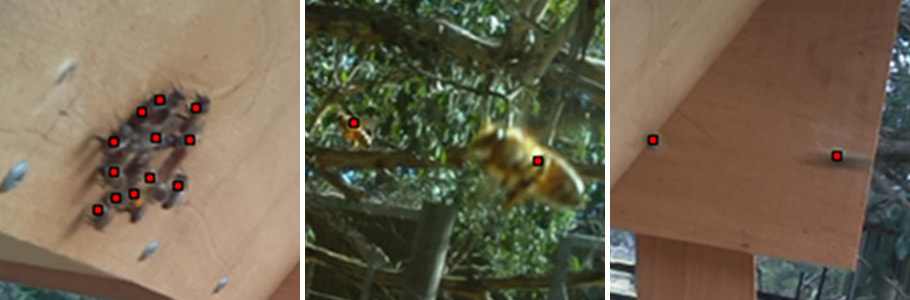 From left to right: high density around the entrance; bees of different sizes; bees at high speed!
Marking Tricks
Semi-controlled learning
The possibility of obtaining a large number of images immediately suggests the use of semi-controlled learning.
Very simple approach:
- Shooting 10,000 images.
- Marking 100 images and training
model_1 . - Use
model_1 to label the remaining 9900 images. - Training
model_2 on the “tagged” 10 000 images.
As a result,
model_2 better than
model_1 .
Here is an example. Please note that
model_1 demonstrates some false positives (left middle and blade of grass) and false negatives (bees around the hive entrance).
 On the left model_1, on the right model_2
Marking by fixing a bad model
Similar data is also a great example of how fixing a bad model is faster than marking from scratch ...
- Mark 10 images and train the model.
- Use the model to mark up the next 100 images.
- We use the marking tool to correct the labels on these 100 images.
- Retraining model on 110 pictures.
- Repeat ...
This is a very common learning pattern, and sometimes it makes you rethink your marking tool a bit.
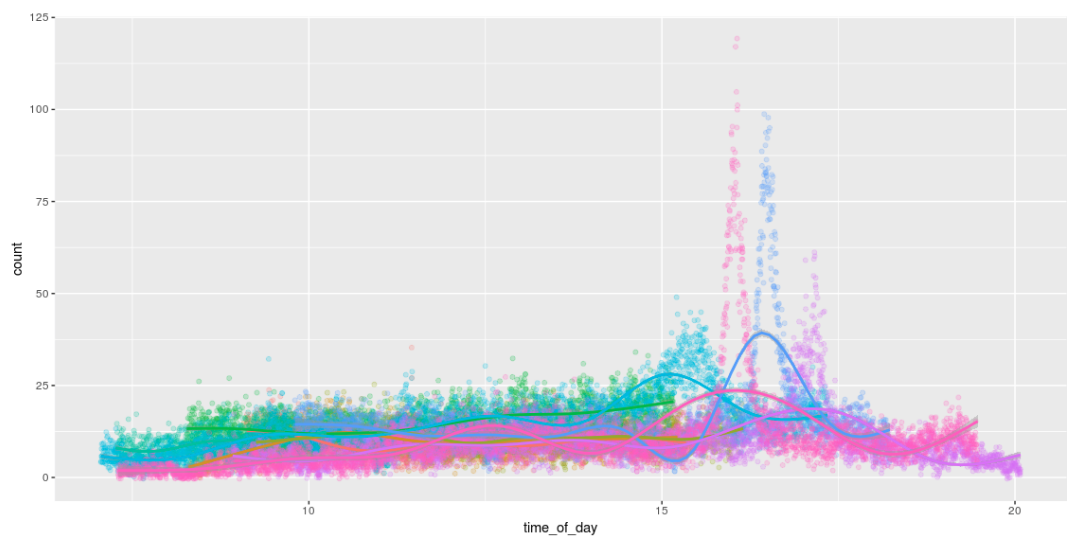
Count
The ability to detect bees means that we can count them! And for fun to draw cool graphics that show the number of bees during the day. I love how they work all day and return home around 4pm. :)
Conclusion on Raspberry Pi
Running the model on Pi was an important part of this project.
Directly on Pi iron
It was originally planned to freeze the TensorFlow graph and simply run it directly on Pi. This works without problems, but Pi only takes 1 image per second. : /
Run on the Movidius Computing Module
I was very interested in the opportunity to run a model on Pi using the
Movidus Neural Compute Stick . This is an amazing gadget.
Unfortunately, nothing happened: /. The API for converting the TensorFlow graph to their internal model format does not support my decoding method. Therefore it was necessary to increase the size (upsizing), using deconvolution instead of resizing by the nearest neighbors. There are no problems here except for the fact that nothing happened. There is a lot of small difficulties, because of which
bugs multiplied . When they are fixed, you can return to this topic ...
Model v3: RGB image → bee countThis led me to the third version of the model: can we go straight from the RGB input to counting the bees? So we will avoid any problems with unsupported operations on the Movidus Neural Compute Stick, although it is unlikely that the result will be as good as in the centroid model v2.
At first I was afraid to try this method: I thought that it would require much more marking (this is no longer a fragments-based system). But! Having a model that does a pretty good job of searching for bees, and a lot of unmarked data, you can generate a good set of synthetic data by applying model v2 and simply counting the number of detections.
Such a model is quite easy to learn and gives meaningful results ... (although it is still not as good as the simple calculation of the centroids found by the v2 model).
| The actual and predicted number of bees in some test samples |
| Real | 40 | nineteen | sixteen | 15 | 13 | 12 | eleven | ten | eight | 7 | 6 | four |
| v2 (centroids) predictive | 39 | nineteen | sixteen | 13 | 13 | 14 | eleven | eight | eight | 7 | 6 | four |
| v3 (simple calculation) forecast | 33.1 | 15.3 | 12.3 | 12.5 | 13.3 | 10.4 | 9.3 | 8.7 | 6.3 | 7.1 | 5.9 | 4.2 |
... unfortunately, the model
still does not work on the Neural Compute Stick (that is, it works, but it produces only random results). I made
a few more bug reports and put the gadget down again to come back later ... someday ...
What's next?
As always, a lot of little things remained ...
- Run on the Neural Compute Stick (NCS); Now we are waiting for some work on their part ...
- Port everything to the JeVois integrated camera . I fiddled with her a bit, but first of all I wanted to launch a model on NCS. I want to track a bee at 120 FPS !!!
- Track bees between multiple frames / cameras to visualize optical flow.
- Learn more about the benefits of the semizable approach and train a larger model to label data for a smaller model.
- Explore the capabilities of NCS; What to do with setting up hyperparamers?
- Go to developing a small version of FarmBot to perform some genetic experiments with seedlings under the control of the CNC (that is, something completely different).
Code
All code is published
on Github .