This tool was written for sports, when I discovered that the pg_stat_activity view in PostgreSQL 10 has wait_event_type and wait_event fields that are very similar to oracle wait_class and event from v $ session.
Actively working at the moment with the ASH-Viewer program from
akardapolov I was curious about how difficult it is to rewrite this product under Postgres. Given that I am not a professional developer, it was not easy, but very interesting. Along the way, I even found, as it seems to me, a couple of significant bugs, which are manifested in the original program for Oracle, as well, for Standard Edition.
How PASH-Viewer works:
No extensions needed. We take data exclusively from the built-in pg_stat_activity view.
Once a second a request is made for active sessions:
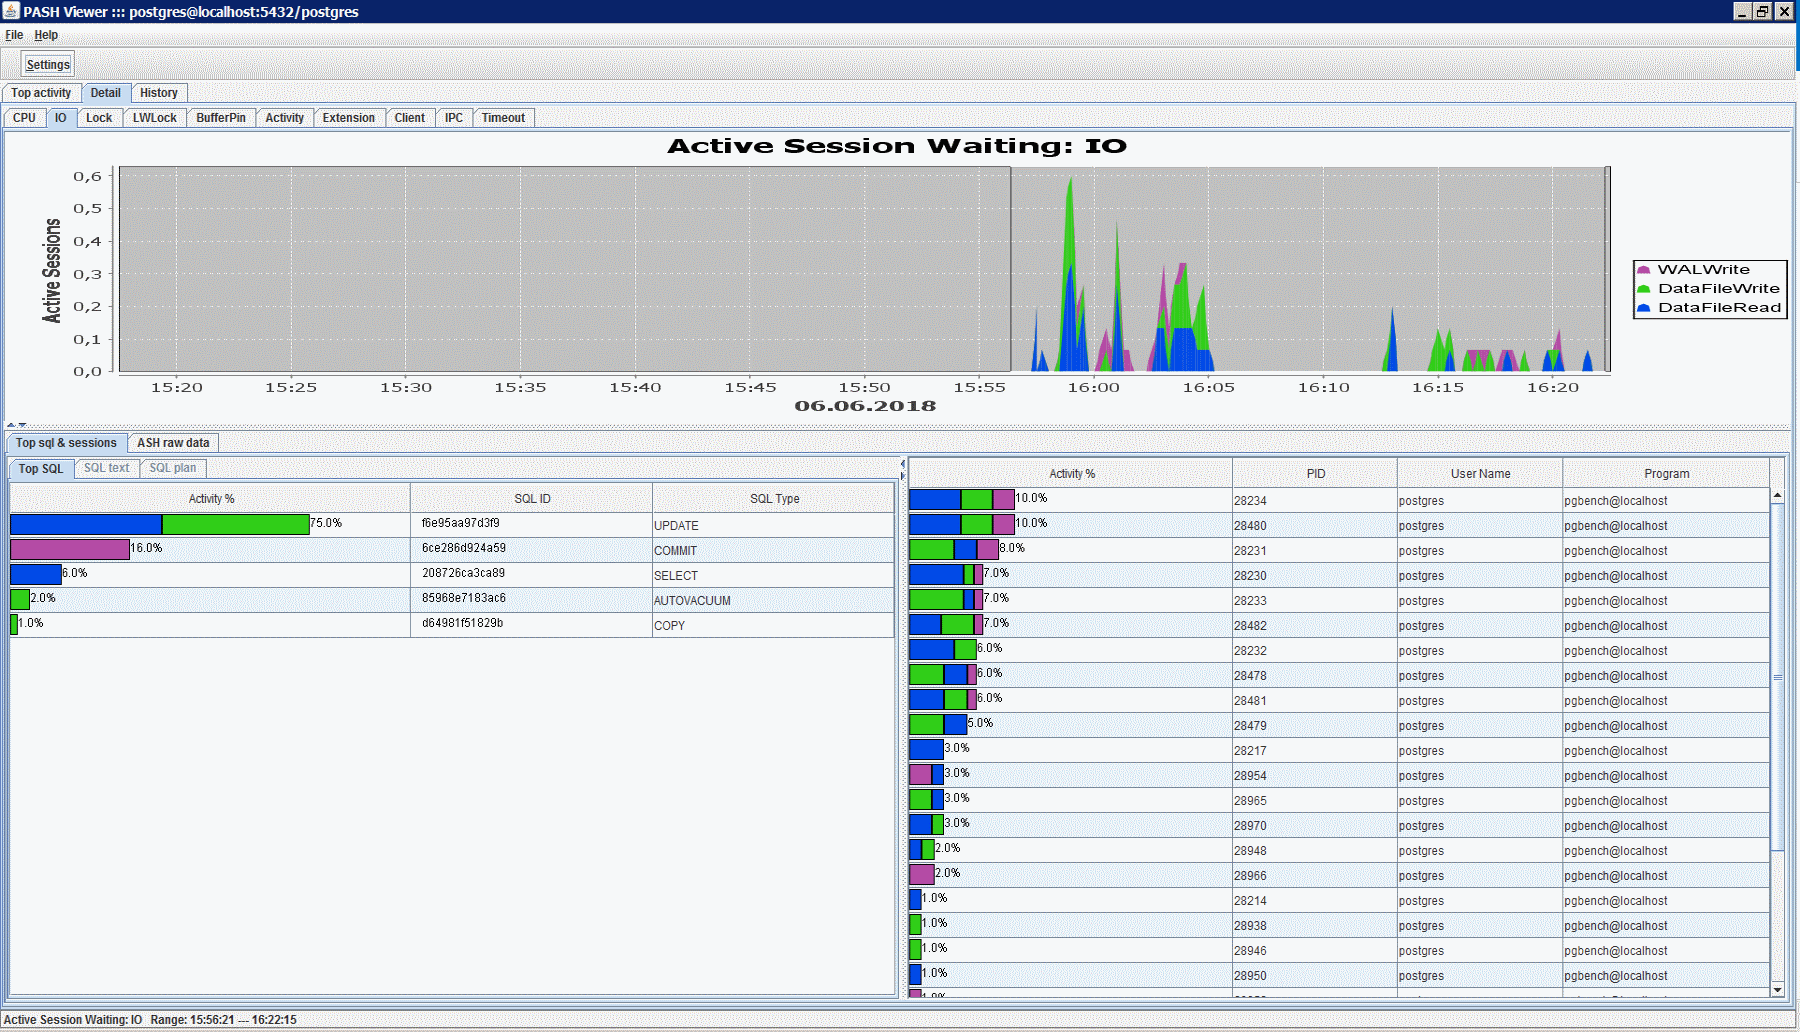
request text to pg_stat_activitySELECT current_timestamp, datname, pid, usesysid, usename, application_name, backend_type, coalesce(client_hostname, client_addr::text, 'localhost') as client_hostname, wait_event_type, wait_event, query, query_start, 1000 * EXTRACT(EPOCH FROM (clock_timestamp()-query_start)) as duration from pg_stat_activity where state='active' and pid != pg_backend_pid();
Every 15 seconds, data for the last 15 images are averaged and displayed on a graph.
The SQL id I need to group the queries in the Top SQL section I generate myself, it has nothing to do with the queryid from pg_stat_statements. I was thinking how to use the queryid, but unfortunately I did not find a way to match the queries from these two views. It would be great if the developers added a queryid field to pg_stat_activity.
SQL id = first 13 characters from md5 (normalized query text).
The normalized query text is a query in which newline characters and extra spaces are removed, and the literals are replaced with $ 1, $ 2, etc. ... It was difficult for me to write a good query normalization function. I wrote a bad one. I bring the text, but you please do not watch it, otherwise I am ashamed. Better send good.
NormalizeSQL public static String NormalizeSQL(String sql) { sql = sql.replaceAll("\\n", " "); sql = sql.replaceAll("\\(", " ( "); sql = sql.replaceAll("\\)", " ) "); sql = sql.replaceAll(",", " , "); sql = sql.replaceAll("'", " ' "); sql = sql.replaceAll("=", " = "); sql = sql.replaceAll("<", " < "); sql = sql.replaceAll(">", " > "); sql = sql.replaceAll(";", ""); sql = sql.replaceAll("[ ]+", " "); sql = sql.replaceAll("> =", ">="); sql = sql.replaceAll("< =", "<="); sql = sql.toLowerCase().trim(); String[] array = sql.split(" ", -1); int var_number = 0; String normalized_sql = ""; Boolean quote_flag = false; for (int i = 0; i < array.length; i++) { if (array[i].equals("'")) { if (!quote_flag) { quote_flag = true; var_number++; normalized_sql += "$" + var_number + " "; } else { quote_flag = false; } } else if (quote_flag) { continue; } else if (array[i].matches("-?\\d+(\\.\\d+)?")) { var_number++; normalized_sql += "$" + var_number + " "; } else if (array[i].equals("order")) { for (int j = i; j < array.length; j++) { normalized_sql += array[j] + " "; } return normalized_sql.trim(); } else { normalized_sql += array[i] + " "; } } return normalized_sql.trim(); }
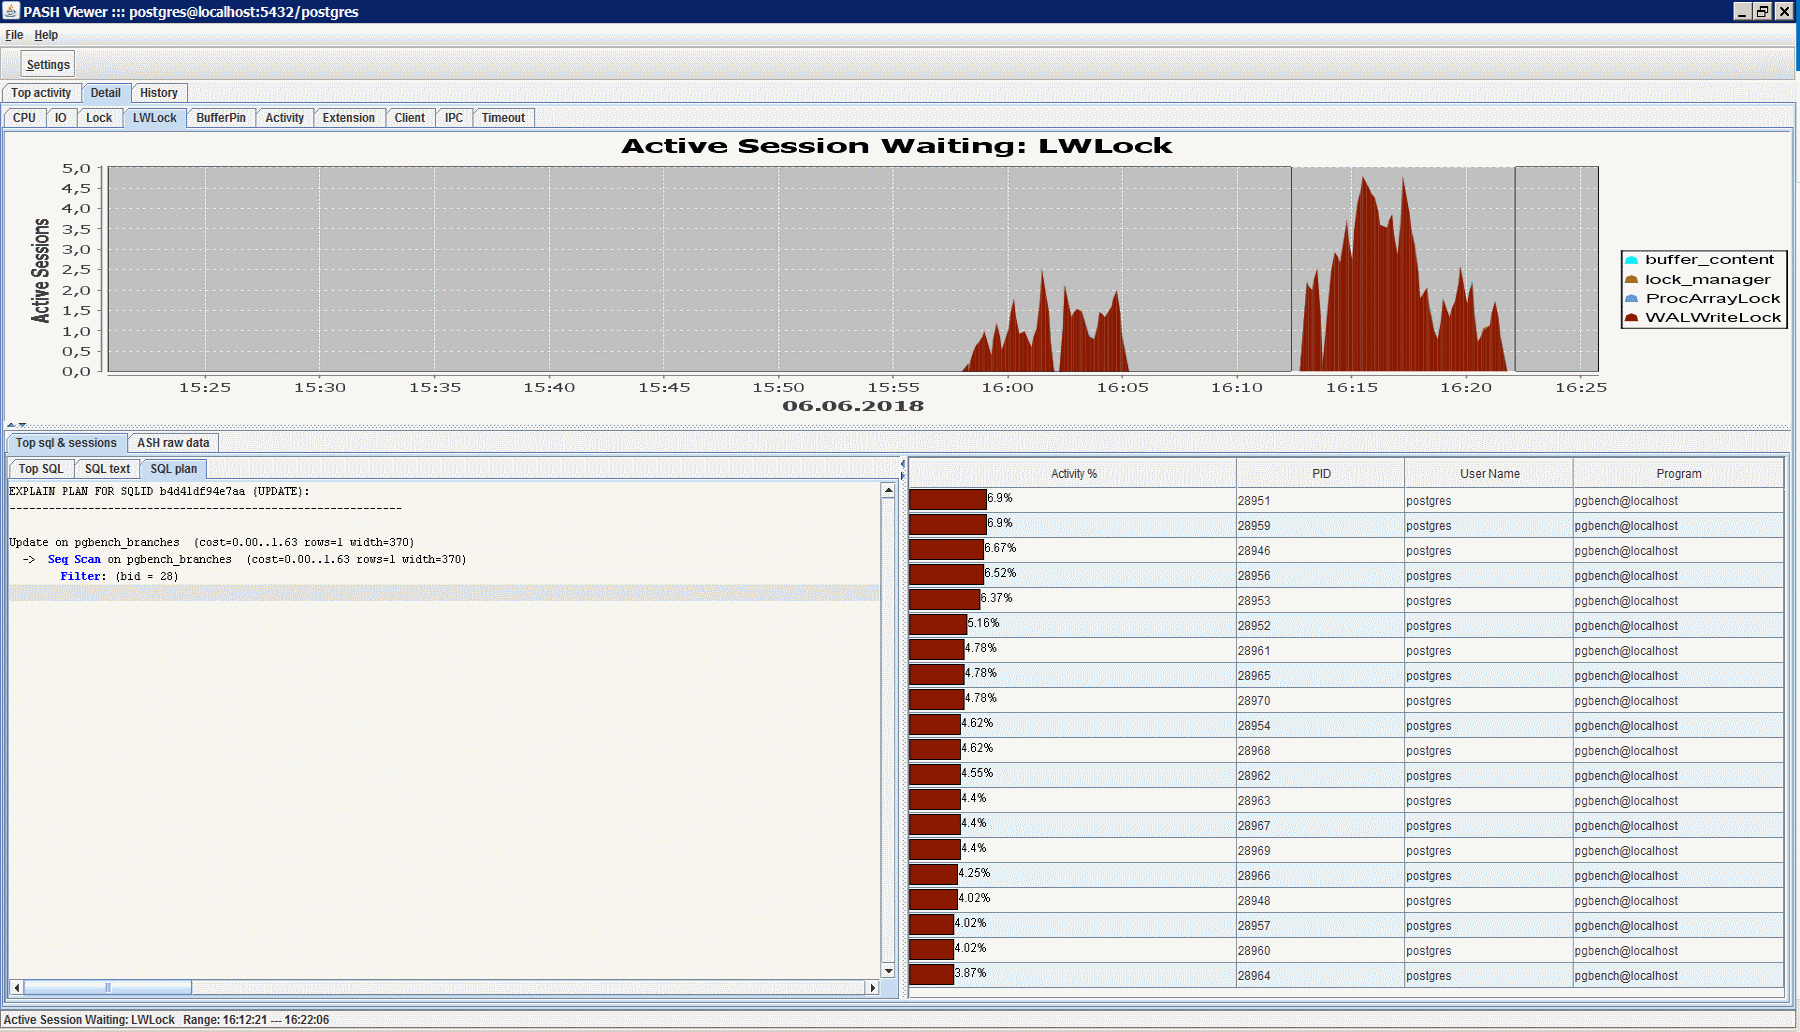
With the query plan was difficult. You come to Oracle and say “Give me a plan for sqlid = ...”, and he answers you - “Do you have the last one, or yesterday, or show everything in the last month with execution statistics for each?”. And PostgreSQL answers you - “What is a sqlid?”.
Therefore, for queries of the SELECT / UPDATE / INSERT / DELETE type, we send the EXPLAIN command to the database and save the result locally. We do this no more than 1 time per hour. During the debugging process, it was discovered that EXPLAIN is hanging on the lock just as the query itself, for which we want to know the plan, was hanging. So I had to add setQueryTimeout (1).
And it works only if the request was executed in the same database to which you connected (specified when setting up the connection). And only if you connect to the database under the superuser (postgres), which some may be afraid. Therefore, you can create a special user for monitoring. Everything will work, except for displaying plans.
CREATE USER pgmonuser WITH password 'pgmonuser'; GRANT pg_monitor TO pgmonuser;
Download from GitHub:
https://github.com/dbacvetkov/PASH-Viewer/releasesUPD:In version 0.3, added support for PostgreSQL 9.6 (there are only two expectation classes - Lock and LWLock, everything else goes like "CPU") and PostgreSQL 9.4 - 9.5 (there is either a CPU or a Lock wait).
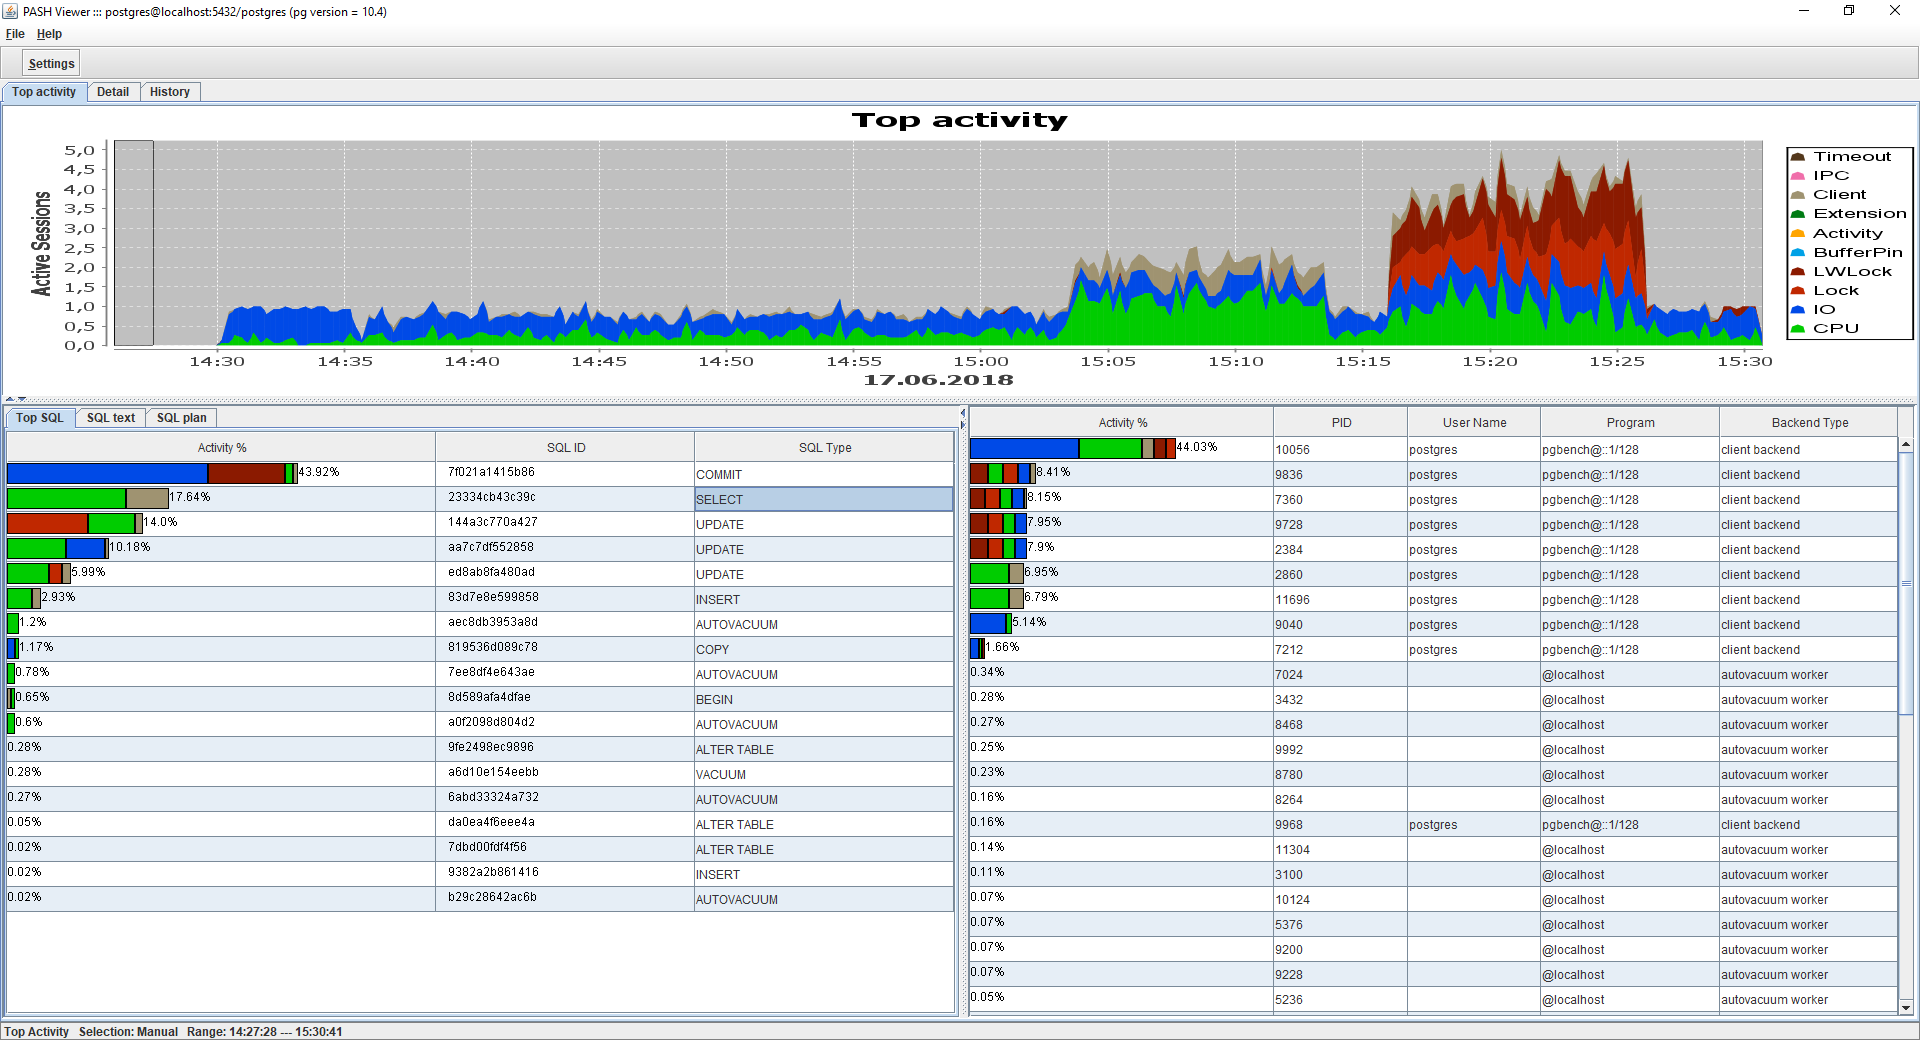
In version 0.3.1, the Backend Type field was added to Top Sessions and got rid of white bars on the graph.
In version 0.3.2, improved work with plans, added some statistics on queries (AVG Duration, Calls Count) and the ability to view historical data:
How-to-create-pg_stat_activity-historical-table .
Thank you and greetings:
Alexander Kardapolov for ASH-Viewer.
Anton Glushakov for consultation and testing.
Dmitry Rudopysov for explaining how to compile and run the project downloaded from github.
More slides: