
In one project related to the security of Linux systems, we needed to intercept calls to important functions inside the kernel (such as opening files and starting processes) in order to be able to monitor activity in the system and proactively block suspicious processes.
During the development process, we managed to invent a fairly good approach that allows you to conveniently intercept any function in the kernel by name and execute your code around its calls. Interceptor can be installed from a loadable GPL module, without rebuilding the kernel. The approach supports kernel versions 3.19+ for the x86_64 architecture.
(Picture of a penguin just above: © En3l with DeviantArt .)Known approaches
Linux Security API
The most correct would be to use
Linux Security API - a special interface created specifically for this purpose. In critical places of the nuclear code, there are calls to security functions, which in turn call callbacks set by the security module. The security module can examine the context of the operation and decide whether to allow or deny it.
Unfortunately, the Linux Security API has a couple of important limitations:
- security modules cannot be loaded dynamically, are part of the kernel and require rebuilding
- there can be only one security module in the system (with some exceptions)
If the position of kernel developers is ambiguous about the multiplicity of modules, the ban on dynamic loading is fundamental: the security module must be part of the kernel in order to ensure security all the time from the moment it is loaded.
Thus, to use the Security API, you need to ship your own kernel assembly, as well as integrate an add-on module with SELinux or AppArmor, which are used by popular distributions. The customer did not want to subscribe to such obligations, so this path was closed.
For these reasons, the Security API did not suit us, otherwise it would be an ideal option.
Modifying the system call table
Monitoring was required mainly for actions performed by user applications, so that, in principle, could be implemented at the level of system calls. As you know, Linux stores all system call handlers in the
sys_call_table table. The substitution of values in this table leads to a change in the behavior of the entire system. Thus, by saving the old values of the handler and substituting our own handler in the table, we can intercept any system call.
This approach has certain advantages:
- Full control over any system calls - the only interface to the core of user applications. Using it we can be sure that we will not miss any important action performed by the user process.
- Minimum overhead. There is a one-time capital investment when updating the system call table. Besides the inevitable monitoring payload, the only expense is the extra function call (for calling the original system call handler).
- Minimum kernel requirements. If desired, this approach does not require any additional configuration options in the kernel, so in theory it supports the widest possible range of systems.
However, it also suffers from some disadvantages:
- Technical complexity of implementation. By itself, the replacement of pointers in the table is not difficult. But related tasks require unobvious solutions and certain qualifications:
- system call table search
- protection bypass from table modification
- atomic and safe replacement performance
These are all interesting things, but they require precious development time, first for implementation and then for support and understanding.
- Inability to intercept some handlers. In kernels prior to version 4.16, the processing of system calls for the x86_64 architecture contained a number of optimizations. Some of them demanded that the system call handler was a special adapter implemented in assembler. Accordingly, such handlers are sometimes difficult, and sometimes completely impossible to replace with their own written in C. Moreover, different optimizations are used in different versions of the kernel, which adds technical difficulties to the piggy bank.
- Only system calls are intercepted. This approach allows you to replace system call handlers, which limits the entry points to only them. All additional checks are performed either at the beginning or at the end, and we have only the arguments of the system call and its return value. Sometimes this leads to the need to duplicate checks on the adequacy of arguments and access checks. Sometimes it causes extra overhead when you need to copy the memory of the user process twice: if the argument is passed through a pointer, you first have to copy it yourself, then the original handler will copy the argument again for yourself. In addition, in some cases, system calls provide too low granularity of events that need to be further filtered from noise.
Initially, we chose and successfully implemented this approach, pursuing the benefits of supporting the largest number of systems. However, at that time we did not yet know about the features of x86_64 and restrictions on intercepted calls. Later, we found critical support for system calls related to the launch of new processes - clone () and execve () - which are just special. That is what led us to search for new options.
Using kprobes
One of the options that were considered was the use of
kprobes : a specialized API, primarily intended for debugging and kernel tracing. This interface allows you to set pre- and post-processors for
any instruction in the kernel, as well as handlers for entry and return from a function. Handlers get access to registers and can change them. Thus, we could get both monitoring and the ability to influence the further course of work.
The advantages that kprobes provides for intercepting:
- Mature API. Kprobes have existed and improved since time immemorial (2002). They have a well-documented interface, most of the pitfalls have already been found, their work is optimized whenever possible, and so on. In general, a whole mountain of advantages over experimental samopisnymi bicycles.
- Interception of any place in the core. Kprobes are implemented using breakpoints (int3 instructions) that are injected into the executable kernel code. This allows kprobes to be installed literally anywhere in any function, if known. Similarly, kretprobes are implemented by replacing the return address on the stack and allow you to intercept the return from any function (except for those that do not return control in principle).
Disadvantages of kprobes:
- Technical complexity. Kprobes is the only way to set a breakpoint anywhere in the kernel. To get the arguments of a function or the values of local variables, you need to know in which registers or where they are on the stack, and extract them yourself from there. To block a function call, you must manually modify the state of the process so that the processor thinks that it has already returned control from the function.
- Jprobes declared obsolete. Jprobes is an add-on to kprobes that allows you to conveniently intercept function calls. It will independently extract function arguments from registers or a stack and call your handler, which should have the same signature as the function being intercepted. The catch is that jprobes are declared obsolete and cut from modern kernels.
- Nontrivial overhead. Setting breakpoints is expensive, but it runs one time. Breakpoints do not affect other functions, but their processing is relatively expensive. Fortunately, for the x86_64 architecture, a jump optimization has been implemented that significantly reduces the cost of kprobes, but it still remains more than, for example, when modifying the system calls table.
- Restrictions kretprobes. Kretprobes are implemented by substituting the return address on the stack. Accordingly, they need to store the original address somewhere in order to return there after processing the kretprobe. Addresses are stored in a fixed-size buffer. In case of its overflow, when the system makes too many simultaneous calls to the intercepted function, kretprobes will skip the responses.
- Disabled displacement. Since kprobes relies on interrupts and juggles processor registers, all the handlers for synchronization are executed with preemption disabled. This imposes certain restrictions on handlers: one cannot wait in them - allocate a lot of memory, do I / O, sleep in timers and semaphores, and other known things.
In the process of researching the topic, our view fell on the
ftrace framework, which can replace jprobes. As it turned out, it is better suited for our needs for intercepting function calls. However, if you need to trace specific instructions within functions, then kprobes should not be discounted.
Splicing
For completeness, it is also worth describing the classic way to intercept functions, which is to replace the instructions at the beginning of the function with an unconditional transition, leading to our handler. Original instructions are transferred to another place and executed before going back to the intercepted function. With the help of two transitions, we sew (splice in) our additional code into the function, so this approach is called
splicing .
This is exactly how jump-optimization for kprobes is implemented. Using splicing, you can achieve the same results, but without additional costs for kprobes and with complete control of the situation.
The benefits of splicing are obvious:
- Minimum kernel requirements. Splicing does not require any special options in the core and works at the beginning of any function. You just need to know her address.
- Minimum overhead. Two unconditional transitions are all actions that the intercepted code needs to perform in order to transfer control to the handler and back. Such transitions are perfectly predicted by the processor and are very cheap.
However, the main drawback of this approach seriously overshadows the picture:
- Technical complexity. She rolls over. You can't just take and rewrite the machine code. Here is a short and incomplete list of tasks that will have to be solved:
- synchronization of installation and removal of interception (what if the function is called right in the process of replacing its instructions?)
- protection bypass for modifying memory regions with code
- Disable processor caches after changing instructions
- disassembling replaceable instructions to copy them whole
- check for the absence of transitions inside the replaced piece
- checking for the ability to move a replaceable piece to another location
Yes, you can peek into kprobes and use the livepatch intranuclear framework, but the final solution still remains quite complicated. It is terrible to imagine how many sleeping problems there will be in each new implementation.
In general, if you are able to invoke this daemon, subordinating only to initiates, and are ready to tolerate it in your code, then splicing is quite a working approach for intercepting function calls. I had a negative attitude to the writing of bicycles, so this option remained as a backup for us in case there would be no progress at all with ready-made solutions easier.
New approach with ftrace
Ftrace is a framework for kernel tracing at the function level. It has been developed since 2008 and has a fantastic interface for user programs. Ftrace allows you to track the frequency and duration of function calls, display call graphs, filter functions of interest by templates, and so on. On the possibilities of ftrace, you can start reading
from here , and then follow the links and official documentation.
It implements ftrace based on the compiler keys
-pg and
-mfentry , which insert at the beginning of each function a call to the special trace function mcount () or __fantry __ (). Usually in user programs this compiler feature is used by profilers to track calls of all functions. The kernel uses these functions to implement the ftrace framework.
Calling ftrace from
each function is, of course, not cheap, so optimization is available for popular architectures:
dynamic ftrace . The bottom line is that the kernel knows the location of all the mcount () or __fentry __ () calls and replaces their machine code with
nop at the early stages of loading - a special instruction that does nothing. When tracing is enabled, ftrace calls are added back to the desired functions. Thus, if ftrace is not used, then its effect on the system is minimal.
Description of the necessary functions
Each intercepted function can be described by the following structure:
struct ftrace_hook { const char *name; void *function; void *original; unsigned long address; struct ftrace_ops ops; };
The user only needs to fill in the first three fields: name, function, original. The remaining fields are considered implementation details. The description of all intercepted functions can be assembled into an array and use macros to increase the compactness of the code:
#define HOOK(_name, _function, _original) \ { \ .name = (_name), \ .function = (_function), \ .original = (_original), \ } static struct ftrace_hook hooked_functions[] = { HOOK("sys_clone", fh_sys_clone, &real_sys_clone), HOOK("sys_execve", fh_sys_execve, &real_sys_execve), };
Wrappers over intercepted functions are as follows:
static asmlinkage long (*real_sys_execve)(const char __user *filename, const char __user *const __user *argv, const char __user *const __user *envp); static asmlinkage long fh_sys_execve(const char __user *filename, const char __user *const __user *argv, const char __user *const __user *envp) { long ret; pr_debug("execve() called: filename=%p argv=%p envp=%p\n", filename, argv, envp); ret = real_sys_execve(filename, argv, envp); pr_debug("execve() returns: %ld\n", ret); return ret; }
As you can see, the functions being intercepted with a minimum of extra code. The only point that requires careful attention is the function signatures. They must match one to one. Without this, obviously, the arguments will be passed incorrectly and everything will go downhill. For interception of system calls, this is less important, since their handlers are very stable and for efficiency, arguments are taken in the same manner as the system calls themselves. However, if you plan to intercept other functions, then you should remember that
there are no stable interfaces inside the kernel .
Ftrace initialization
First we need to find and save the address of the function that we will intercept. Ftrace allows you to trace functions by name, but we still need to know the address of the original function in order to call it.
You can get the address using
kallsyms - a list of all characters in the kernel. This list includes
all characters, not only exported for modules. Getting the address of the intercepted function looks like this:
static int resolve_hook_address(struct ftrace_hook *hook) { hook->address = kallsyms_lookup_name(hook->name); if (!hook->address) { pr_debug("unresolved symbol: %s\n", hook->name); return -ENOENT; } *((unsigned long*) hook->original) = hook->address; return 0; }
Next, you need to initialize the
ftrace_ops structure. It is mandatory
the field is just a
func indicating a callback, but we also need
Set some important flags:
int fh_install_hook(struct ftrace_hook *hook) { int err; err = resolve_hook_address(hook); if (err) return err; hook->ops.func = fh_ftrace_thunk; hook->ops.flags = FTRACE_OPS_FL_SAVE_REGS | FTRACE_OPS_FL_IPMODIFY; }
fh_ftrace_thunk () is our callback, which ftrace will call when tracing a function. About him later. The flags we set will be needed to perform the interception. They instruct ftrace to save and restore processor registers, the contents of which we can change in the callback.
Now we are ready to enable interception. To do this, you must first enable ftrace for the function of interest using ftrace_set_filter_ip (), and then allow ftrace to call our callback using register_ftrace_function ():
int fh_install_hook(struct ftrace_hook *hook) { err = ftrace_set_filter_ip(&hook->ops, hook->address, 0, 0); if (err) { pr_debug("ftrace_set_filter_ip() failed: %d\n", err); return err; } err = register_ftrace_function(&hook->ops); if (err) { pr_debug("register_ftrace_function() failed: %d\n", err); ftrace_set_filter_ip(&hook->ops, hook->address, 1, 0); return err; } return 0; }
Interception is turned off in the same way, only in reverse order:
void fh_remove_hook(struct ftrace_hook *hook) { int err; err = unregister_ftrace_function(&hook->ops); if (err) { pr_debug("unregister_ftrace_function() failed: %d\n", err); } err = ftrace_set_filter_ip(&hook->ops, hook->address, 1, 0); if (err) { pr_debug("ftrace_set_filter_ip() failed: %d\n", err); } }
After the unregister_ftrace_function () call is completed, the absence of activations of the installed callback in the system (and with it our wrappers) is guaranteed. Therefore, we can, for example, safely unload the interceptor module without fearing that our functions are still performed somewhere in the system (after all, if they disappear, the processor will be upset).
Perform interception
How is the actual interception? Very simple. Ftrace allows you to change the state of the registers after exiting the callback. By changing the% rip register — the pointer to the next executable instruction — we change the instructions that the processor executes — that is, we can force it to perform an unconditional transition from the current function to ours. Thus, we take control over ourselves.
The callback for ftrace looks like this:
static void notrace fh_ftrace_thunk(unsigned long ip, unsigned long parent_ip, struct ftrace_ops *ops, struct pt_regs *regs) { struct ftrace_hook *hook = container_of(ops, struct ftrace_hook, ops); regs->ip = (unsigned long) hook->function; }
Using the container_of () macro, we get the address of our
struct ftrace_hook at the address of the
struct ftrace_hook embedded in it, and then we replace the value of the% rip register in the
struct pt_regs structure with the address of our handler. Everything. For architectures other than x86_64, this register may be called differently (like IP or PC), but the idea is in principle applicable to them.
Notice the
notrace specifier added to the callback. They can mark functions that are not allowed for tracing with ftrace. For example, the functions of ftrace itself that are involved in the tracing process are labeled this way. This helps to prevent the system from hanging in an infinite loop while tracing all functions in the kernel (ftrace can do this).
A callback ftrace usually triggers with displacement disabled (like kprobes). There may be exceptions, but you should not count on them. In our case, however, this restriction is not important, so we just replace eight bytes in the structure.
The wrapper function that is called later will be executed in the same context as the original function. Therefore, there you can do the same that is allowed to do in the intercepted function. For example, if you intercept an interrupt handler, then you still cannot sleep in a wrapper.
Recursive Call Protection
: , ftrace, , . - .
, —
parent_ip — ftrace-, , . . , .
,
parent_ipshould point inside our wrapper, whereas in the first, somewhere else in the kernel. It is necessary to transfer control only at the first call of the function, all the others must allow the original function to be executed.Entry checking can be done very efficiently by comparing the address with the boundaries of the current module (which contains all our functions). This works fine if in a module only a wrapper calls an intercepted function. Otherwise, you need to be more selective.So, the correct ftrace callback is as follows: static void notrace fh_ftrace_thunk(unsigned long ip, unsigned long parent_ip, struct ftrace_ops *ops, struct pt_regs *regs) { struct ftrace_hook *hook = container_of(ops, struct ftrace_hook, ops); if (!within_module(parent_ip, THIS_MODULE)) regs->ip = (unsigned long) hook->function; }
Distinctive features / advantages of this approach:- Low overhead. Just a few subtractions and comparisons. No spinlock, list passes, and so on.
- . . , .
- . kretprobes , ( ). , .
:
ls , . (, Bash)
fork () +
execve () .
clone() execve() . , execve(), .
- :
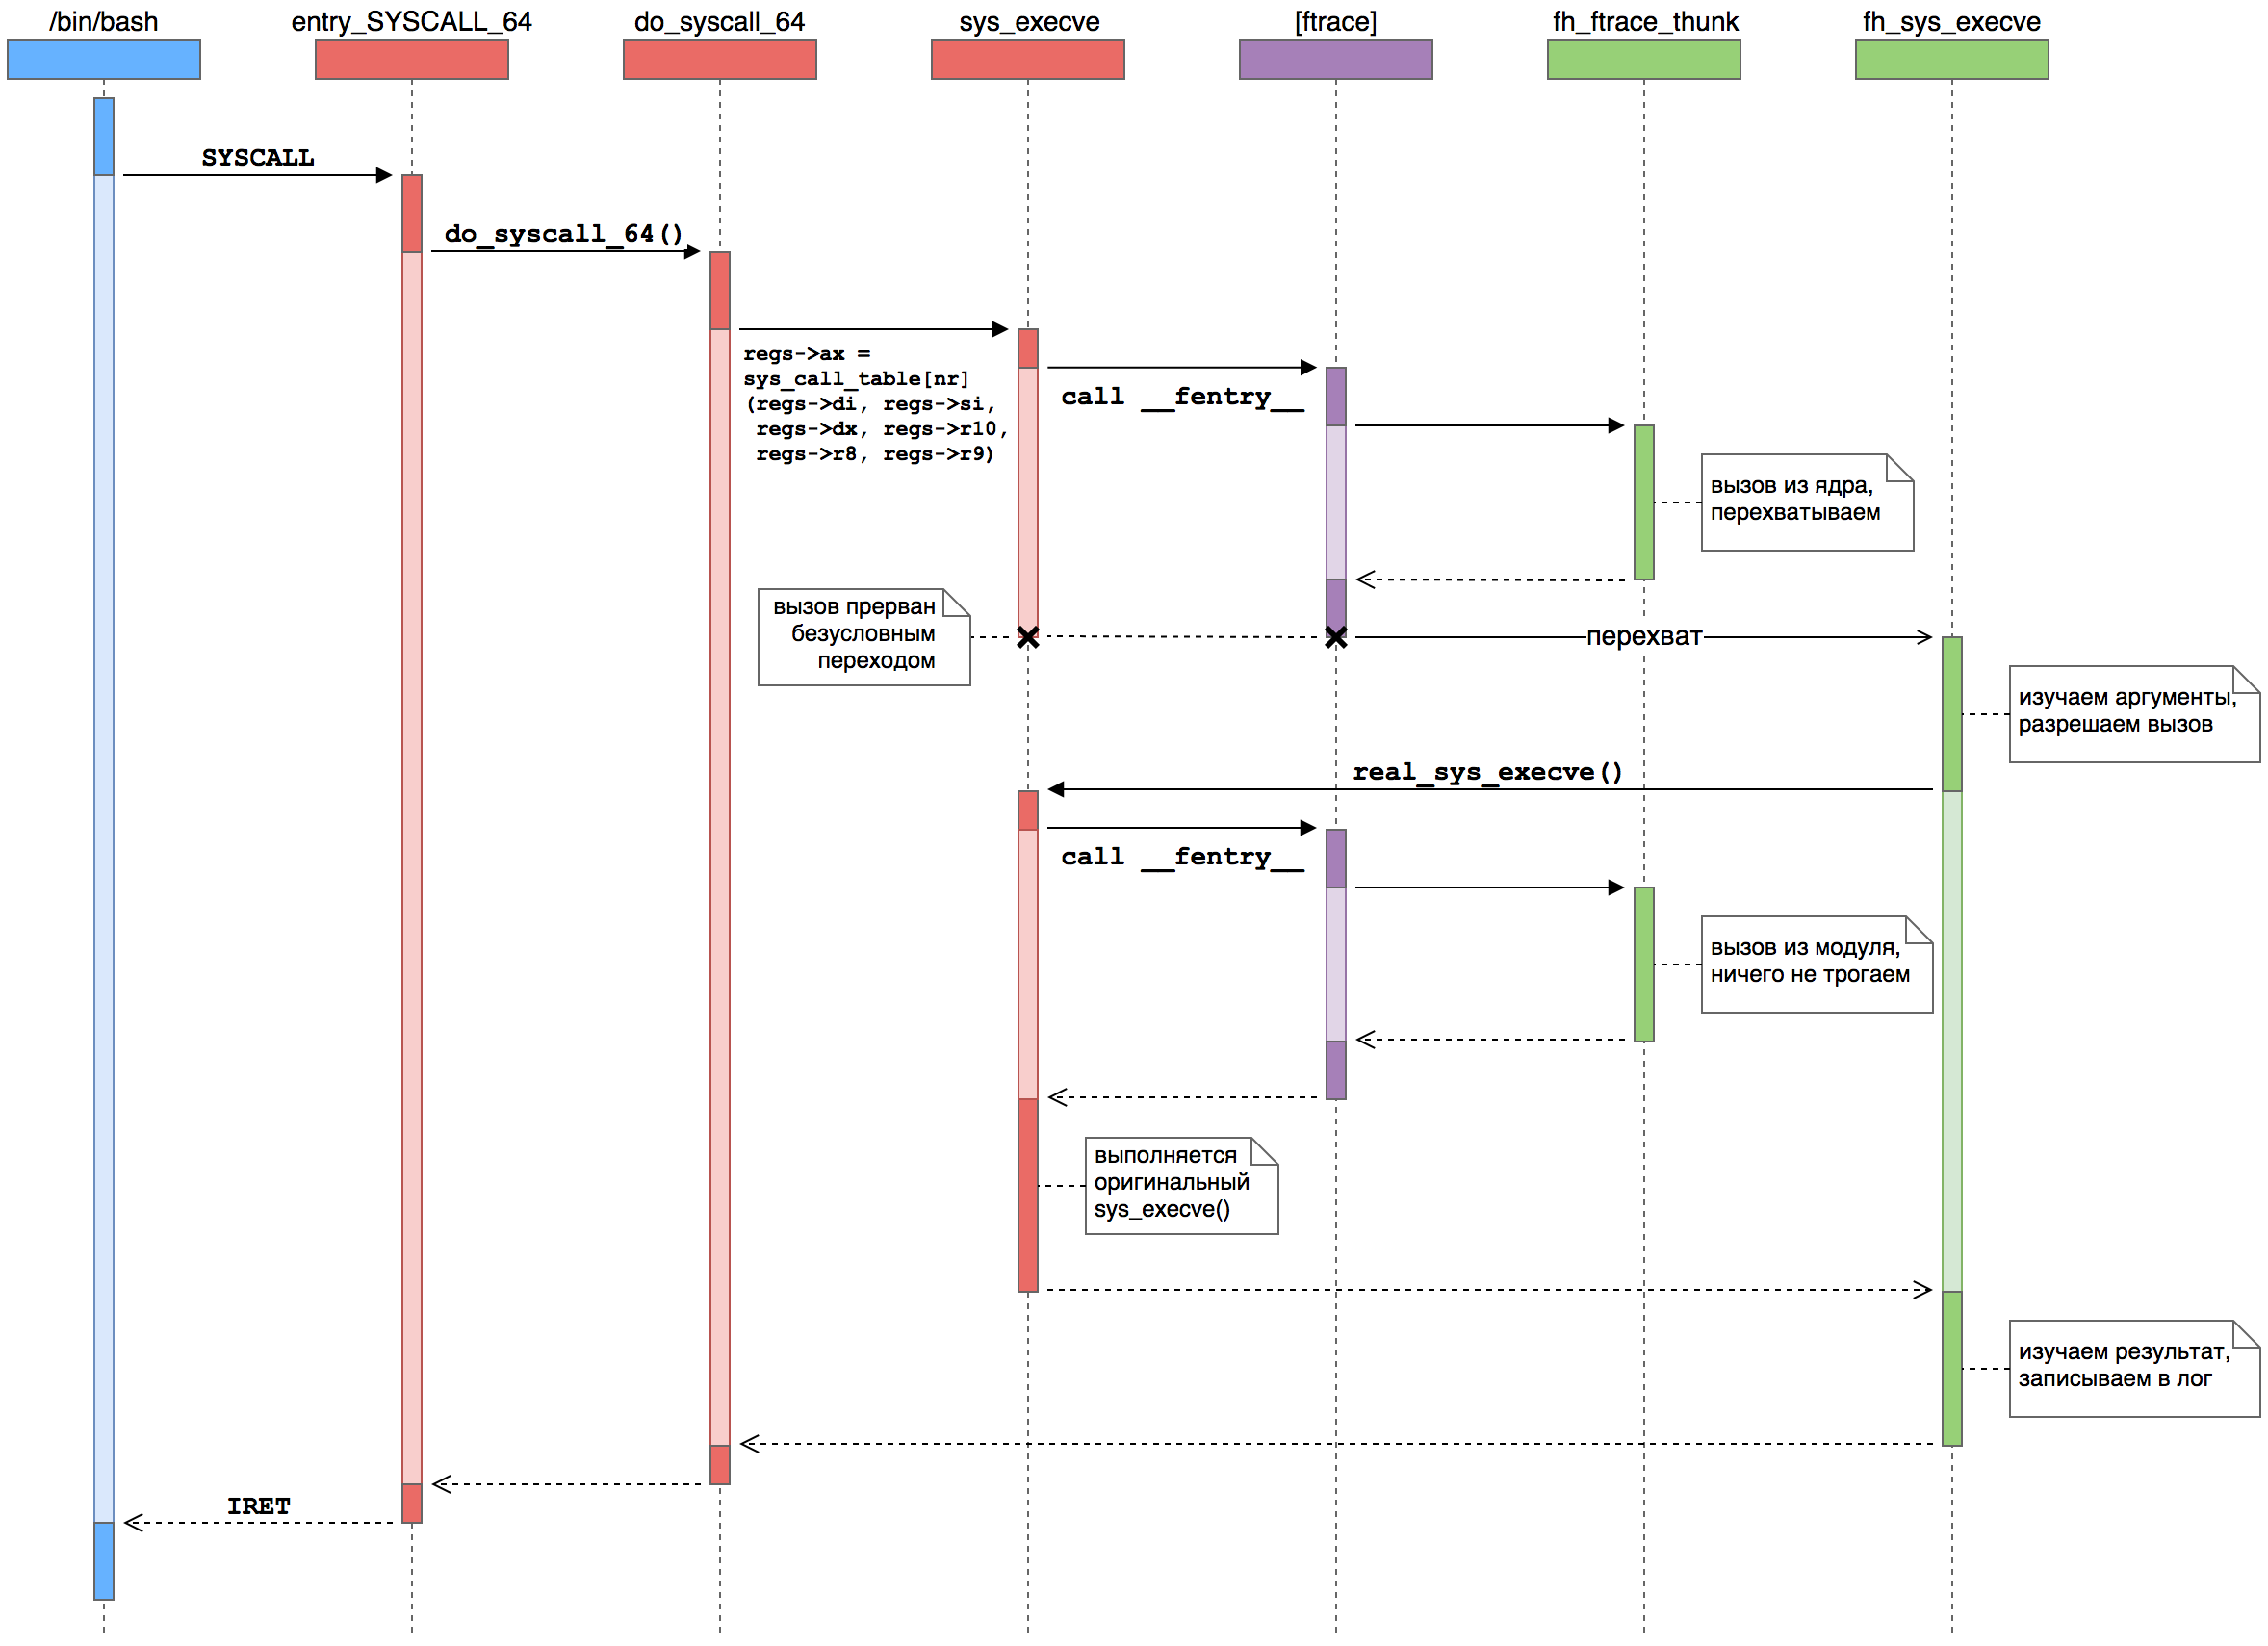
, (
) (
), where the ftrace ( purple ) framework calls functions from our module ( green ).- The user process executes SYSCALL. This instruction switches to kernel mode and transfers control to the low-level system call handler, entry_SYSCALL_64 (). It is responsible for all system calls of 64-bit programs on 64-bit kernels.
- . , , do_syscall_64 (), .
sys_call_table — sys_execve ().
- ftrace. __fentry__ (), ftrace. , , nop , sys_execve() .
- Ftrace . ftrace , . , %rip, .
- .
parent_ip , do_syscall_64() — sys_execve() — , %rip pt_regs .
- Ftrace . FTRACE_SAVE_REGS, ftrace
pt_regs . ftrace . %rip — — .
- -. - sys_execve() . fh_sys_execve (). , do_syscall_64().
- . . fh_sys_execve() ( ) . . — sys_execve() , real_sys_execve , .
- . sys_execve(), ftrace . , -…
- . sys_execve() fh_sys_execve(), do_syscall_64(). sys_execve() . : ftrace sys_execve() .
- . sys_execve() fh_sys_execve(). . , execve() , , , . .
- Control is returned to the kernel. Finally, fh_sys_execve () is terminated and control passes to do_syscall_64 (), which assumes that the system call was completed as usual. The core continues its nuclear affairs.
- The control is returned to the user process. Finally, the kernel executes an IRET (or SYSRET) instruction, but for execve () it is always an IRET, setting registers for the new user process and putting the CPU in the execution mode of the user code. The system call (and the launch of the new process) is complete.
Advantages and disadvantages
As a result, we get a very convenient way to intercept any functions in the kernel, which has the following advantages:- API . . , , . — -, .
- . . - , , , - . ( ), .
- Interception is compatible with tracing. Obviously, this method does not conflict with ftrace, so you can still remove very useful performance indicators from the kernel. Using kprobes or splicing can interfere with ftrace mechanisms.
What are the disadvantages of this solution?- Kernel configuration requirements. For successful interception of functions using ftrace, the kernel must provide a number of possibilities:
- kallsyms character list for searching functions by name
- the whole ftrace framework for tracing
- critical interception ftrace options
. , , , , . , - , .
- ftrace , kprobes ( ftrace ), , , . , ftrace — , «» ftrace .
- . , . , , ftrace . , , .
- Double call ftrace. The pointer analysis approach described above
parent_ipresults in a rerun of ftrace for intercepted functions. This adds a bit of overhead and can knock down the readings of other traces that will see twice as many calls. This drawback can be avoided by using a bit of black magic: the ftrace call is located at the beginning of the function, so if the address of the original function is moved forward by 5 bytes (the length of the call instruction), then ftrace can be jumped.
Consider some of the disadvantages in more detail.Kernel configuration requirements
For starters, the kernel must support ftrace and kallsyms. To do this, the following options should be enabled:- CONFIG_FTRACE
- CONFIG_KALLSYMS
Then, ftrace should support dynamic modification of registers. The option is responsible for this opportunity.- CONFIG_DYNAMIC_FTRACE_WITH_REGS
Further, the kernel used should be based on version 3.19 or higher in order to access the FTRACE_OPS_FL_IPMODIFY flag. Earlier versions of the kernel also know how to replace the% rip register, but starting from 3.19, this should be done only after setting this flag. The presence of a flag for old kernels will lead to a compilation error, and its absence for new ones will lead to non-working interception.Finally, to perform an interception, the location of the ftrace call inside the function is critical: the call must be placed at the very beginning, before the function prologue (where space is allocated for local variables and a stack frame is formed). This feature of the architecture is taken into account by the optionx86_64 , i386 — . - i386 ftrace , ftrace . %eip — , , .
ftrace 32- x86. , ( «»), , ftrace.
During testing, we encountered one interesting feature : on some distributions, interception of functions caused the system to hang tightly. Naturally, this happened only on systems other than those used by developers. The problem was also not reproduced on the original interception prototype, with any distributions and kernel versions.Debugging showed that a hang occurs inside the intercepted function. For some mystical reason, when calling the original function inside the ftrace-callback, the address parent_ipcontinued to be pointed to the kernel code instead of the wrapper function code. Because of this, there was an infinite loop, as ftrace repeatedly caused our wrapper, without performing any useful actions.Fortunately, we had both working and broken code at our disposal, so finding the differences was only a matter of time. After the unification of the code and ejection of all unnecessary, the differences between the versions could be localized to the wrapper function.This option worked: static asmlinkage long fh_sys_execve(const char __user *filename, const char __user *const __user *argv, const char __user *const __user *envp) { long ret; pr_debug("execve() called: filename=%p argv=%p envp=%p\n", filename, argv, envp); ret = real_sys_execve(filename, argv, envp); pr_debug("execve() returns: %ld\n", ret); return ret; }
and this one - hung the system: static asmlinkage long fh_sys_execve(const char __user *filename, const char __user *const __user *argv, const char __user *const __user *envp) { long ret; pr_devel("execve() called: filename=%p argv=%p envp=%p\n", filename, argv, envp); ret = real_sys_execve(filename, argv, envp); pr_devel("execve() returns: %ld\n", ret); return ret; }
How does it come about that the level of logging affects behavior? A careful study of the machine code of the two functions quickly clarified the situation and caused the very feeling when the compiler was to blame. Usually he is on the list of suspects somewhere near the cosmic rays, but not this time.The point, as it turned out, is that the pr_devel () calls are expanded to void. This version of the printk macro is used for logging during development. Such entries in the log are not interesting during operation, so they are automatically cut from the code, if you do not declare the DEBUG macro. After that, the function for the compiler turns into this: static asmlinkage long fh_sys_execve(const char __user *filename, const char __user *const __user *argv, const char __user *const __user *envp) { return real_sys_execve(filename, argv, envp); }
And here come the optimization. In this case it worked so-called optimization tail calls (tail call optimization). It allows the compiler to replace an honest function call with a direct transition to its body, if one function calls another and immediately returns its value. In native code, an honest call looks like this: 0000000000000000 <fh_sys_execve>: 0: e8 00 00 00 00 callq 5 <fh_sys_execve+0x5> 5: ff 15 00 00 00 00 callq *0x0(%rip) b: f3 c3 repz retq
and non-working - like this: 0000000000000000 <fh_sys_execve>: 0: e8 00 00 00 00 callq 5 <fh_sys_execve+0x5> 5: 48 8b 05 00 00 00 00 mov 0x0(%rip),%rax c: ff e0 jmpq *%rax
CALL — __fentry__(), . real_sys_execve ( ) CALL fh_sys_execve() RET. real_sys_execve() JMP.
«» , , CALL. , —
parent_ip . fh_sys_execve() , — .
parent_ipcontinues to point inside the core, which ultimately leads to the formation of an infinite loop.It also explains why the problem was reproduced only on some distributions. When compiling modules, different distributions use different sets of compilation flags. In distressed distributions, tail call optimization was enabled by default.The solution for us was to turn off tail optimization for the entire file with wrapper functions: #pragma GCC optimize("-fno-optimize-sibling-calls")
Conclusion
… Linux — . , - , .
,
Github .