In this article, we will share our own practical experience that we acquired when testing the Web Apps application (online store) working in the MS Azure cloud, and also describe what tools we used to solve this problem and the conclusions that were made results.

Test object
We chose VirtoCommerce Storefront as the objects for testing (a web application used as a front end of applications created on the VirtoCommerce platform).
To get a real picture of the capabilities of the system, we need to simulate user requests as close as possible to reality. It makes no sense to check the main page, which may be in the cache and then assert that our speed was 1k req / sec. There is no sense from such a metric of performance in real life.
Therefore, in order for our test results to be statistically significant and as closely as possible reflect the performance indicators on real traffic, it was decided to use queries as close as possible to the actual behavior of the user in the online store.
Let us dwell on the following actions, which will consist of our "real" test:
User action (test type)
| Specific percentage of total requests
|
View a unique category page with its products.
| thirty%
|
View unique product card
| 40%
|
Add items to cart
| ten%
|
Search products by unique keyword phrase or attribute
| 20%
|
Fig. 1. The main actions of users and their specific frequency of use.Preparation of test data
The most important phase for any test is data preparation. Test data should be selected in such a way that as closely as possible correspond to the data in a real system, both in quantity and quality (communication, structure, etc.). If possible, the total amount of data should be sufficient to ensure that when testing as little as possible there are repeated references to the same data, thus avoiding frequent use of the cache and, as a result, get the most pessimistic picture of the system performance.
The main data for an online store, as a rule, are: a catalog of products and categories with prices, discounts and information about balances.
The actual data of the catalog, which will be used in the main production-environment, was used as the test environment filling:
 Fig.2. Data used to populate the system under test.
It is clear that for a reader who is not familiar with the structure of the VirtoCommerce catalog, some data types may mean nothing, but nevertheless, we will give them in order to at least have an idea of the quantitative order.
Project preparation and test recording
As the main tool for load testing, we will use MS Visual Studio Enterprise 2017 (in other editions of the studio, support for this type of project may not be available) and the project type
Web Performance and Load Test Project .
 Fig.3. Creating a new project.
After creating the project, we will need to create tests for each of the previously defined custom actions. We confine ourselves to creating a test for one user action as an example, since the other actions are created by analogy.
For the tests, we will use the standard Web Performance Test type test built into Visual Studio.
Our first test, which we will create, will be a test that opens the product details in the online store.
To create a test, select the type of test
“Web Performance Test” from the list offered by Studio, set the name
“Storefront-ProductDetail” .
 Fig.4. Select the type of test in Visual Studio.
For this type of test, Visual Studio will immediately try to open the browser, where it will be possible to interactively click on the necessary actions directly on the site, but we will not do this, but immediately close the browser and stop recording. As a result, we get an empty test
Storefront-ProductDetail.webtest .
Next, we need to add a data source for this test in order to be able to use different query parameters within one test, for this purpose V V
Studio Web Performance Test is provided.
As a data source for our test, we will use a table in the database where product records are stored. After that, we will be able to use data from the connected source in the request, which should open the product details on the application under test. This is achieved by inserting the construct
“{{The name of the data source. The name of the table. The name of the column}}”In the end, after all the manipulations, our first test will take this form.
 Fig. 5. Test content
It is time for the first run, we will try to run our test and make sure that it works correctly.
 Fig. 6. The result of a single test
By analogy, we will create tests for all our other scenarios.
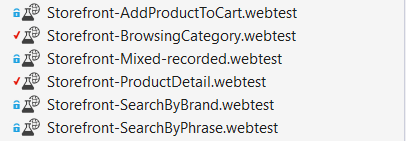 Fig. 7. Result Test Suite
After that, we have almost everything ready to create a combined test that will emulate the real user behavior on the site.
To do this, add a new
LoadTest to our project
.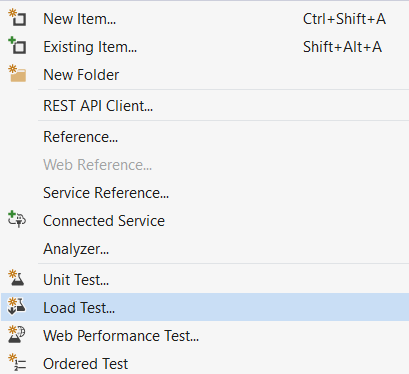 Fig.8. Creating a new load test
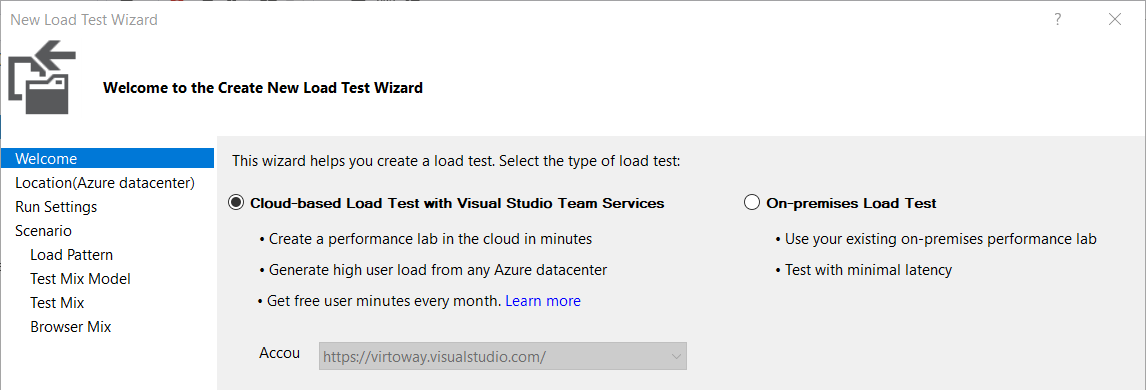
In the wizard that appears, select the type of the
On-premises load test .
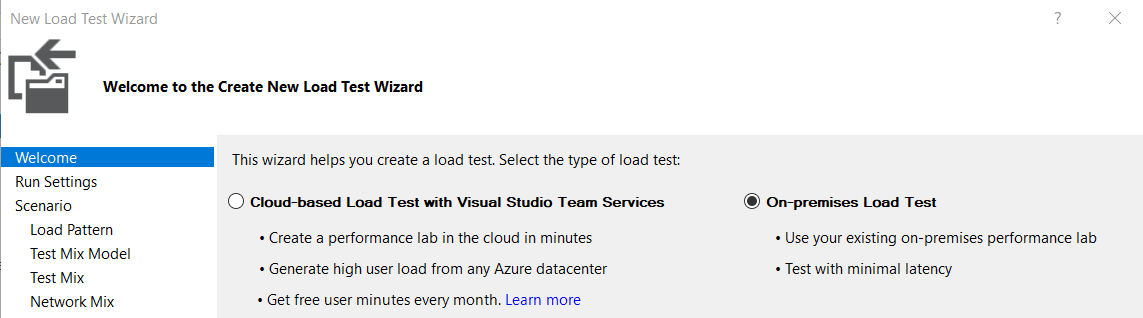 Fig. 9. Select the type of test
This paragraph requires some clarification, because you rightly ask: “And then on-premise?” The topic of the article on testing with the help of Teams Services and MS Azure, but there is a nuance here, since we use data sources in the form of tables or other external ones for tests. services, there may be some difficulties with this when we try to run this test in the cloud.
After vain attempts to make such tests work in the cloud, we abandoned this venture and decided to use for testing the so-called “recorded” tests, which are obtained by recording requests generated by tests that are working locally and have a connection to data sources.
To record the tests, we use Fiddler, which has the ability to export requests to the
Visual Studio Web Tests format. A little further we will tell in more detail about the procedure for recording such a test.
In the subsequent steps, we choose the test duration, the number of users and, most importantly, we specify which tests our
MixedLoadTest will consist of and in what proportions they will be used.
 Fig.10. Components of the test
As a result, after all the actions we get a combined
MixedLoadTest , configured to run for a locally-deployed application.
Next, we need to run this test and try to record with
Fiddler all requests that will be generated as a result of the test, and also get a “record” that we can run directly in the cloud.
Pre-run
Fiddler and our
MixedLoadTest test.
 Fig. 11. Test result
After working out all the data we get this picture in Fiddler
 Fig. 12. Test session in Fiddler
Next, in Fiddler we save all sessions in the format of
Visual Studio Web Tests ,
File -> Export sessions -> All sessions -> Visual Studio Web Tests and add the resulting file to the project. Let me remind you that this action is necessary in order for us to get a test without being tied to external data sources, as with the launch of such tests, problems may arise in the cloud environment.
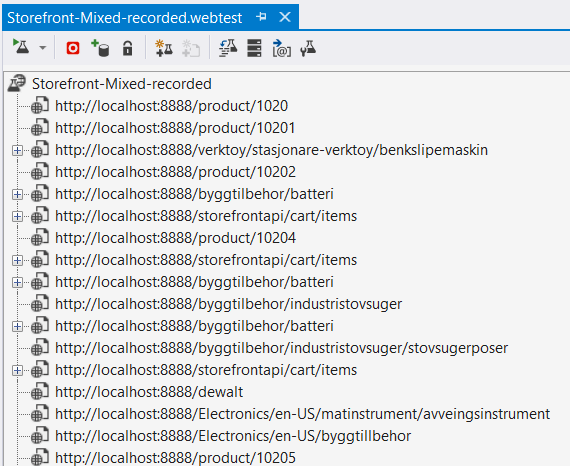 Fig. 13. Details of the “recorded” test
Now almost everything is ready to run our test in the cloud, the last step in preparing the test is to open the “recorded”
MixedLoadTest in any text editor and replace
localhost : 8888 (proxy address, Fiddler) with our store address in the cloud.
Running a test in the cloud
To run tests in the cloud, we need a valid account in
Visual Studio Team Services .
We create a new LoadTest, only this time we choose
Cloud-based Load Test with Visual Studio Team Services .
In the next steps, we select a data center from which traffic will be generated for the test resource, as well as the maximum number of agents (users) for the constant pattern, or if we want to use a gradual increase in load, then we need to set the appropriate parameters.

In the test selection step, we select the only test we recorded earlier using
Fiddler , it will emulate the “real” load on the test resource.

After the creation is completed, we launch a test, in the course of which the studio will show some key metrics, such as performance and bandwidth, as well as build real-time graphs.
 Fig. 14. The process of the test in the cloud
After the test is completed, you can also view the saved web report in VSTS:

 Fig. 15. Web report on Visual Studio Team Services portal
Results analysis
The most important point is the processing and analysis of the test results obtained. For the task in question, it was necessary to evaluate the performance of the application running on various configurations of Azure Web Apps B2 and B3 rates.
To do this, we run the “recorded” test again for the application on different configurations and recorded the results in an Excel document.
The result was this report:
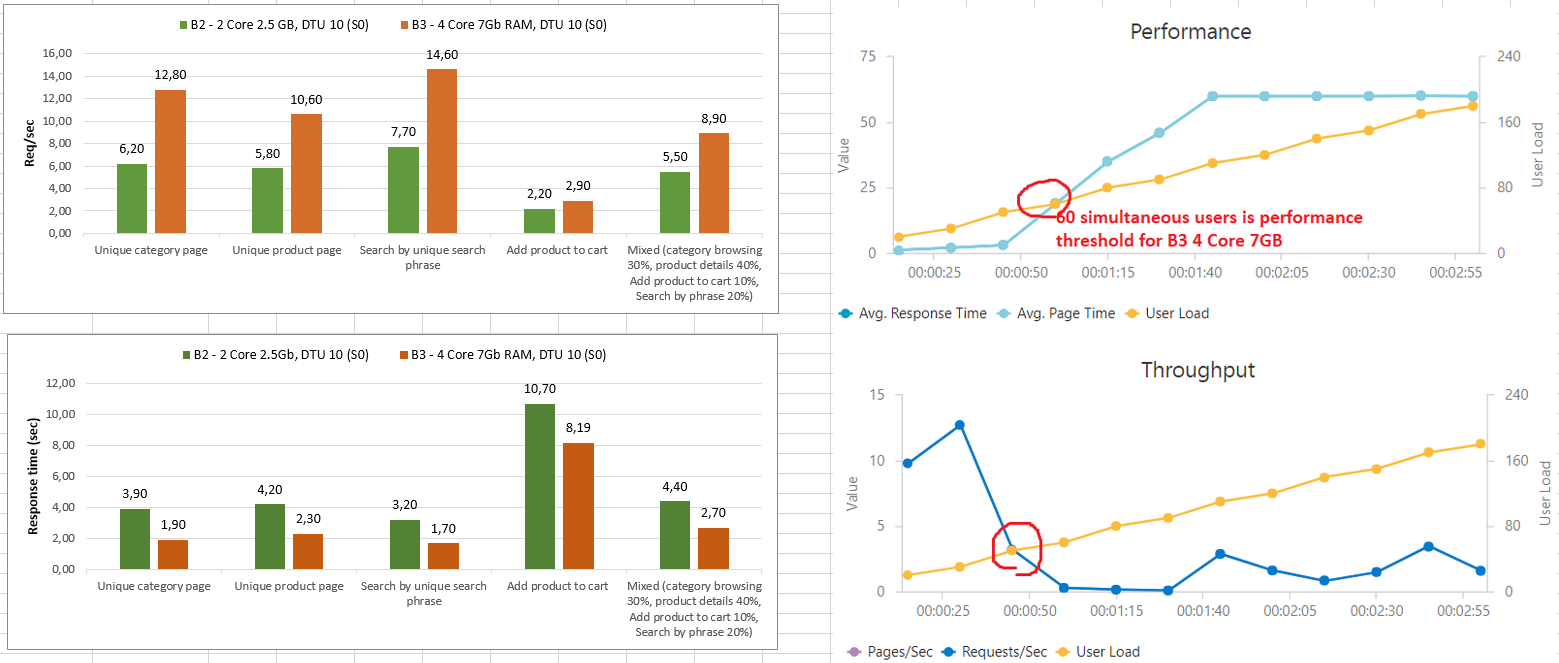 Fig.16. Resulting Test Report
After analyzing the data, we managed to find out the maximum load that our application can withstand - it is about 60 simultaneous users or 9 requests / sec. with an average time to return the page 2.5 seconds. The graph shows that performance problems begin abruptly after a certain threshold number of requests.
As it turned out later, the reason for this was the 100% load on the processor, due to the fact that we used a third-party library for server-side rendering of pages, which used regular expressions for tokenization and parsing markup.
findings
The performance of an actively developing application always has a very strong tendency to degradation, because any change, even the smallest from the point of view of a developer, can lead to dramatic consequences for application performance. In this regard, periodic performance testing is an important procedure that should be conducted regularly and be part of Continuous Integrations processes.
The project itself and the reports obtained as a result of testing are available on GitHub .