On May 28, at the
RootConf 2018 conference held during the RIT ++ festival, in the “Logging and Monitoring” section, the report “Monitoring and Kubernetes” was heard. It tells about the experience of setting up monitoring with Prometheus, which was obtained by the company Flant as a result of operating dozens of projects on Kubernetes in production.
By tradition, we are glad to present a
video with a report (about an hour,
much more informative
than an article) and the main squeeze in text form. Go!
What is monitoring?
There are many monitoring systems:
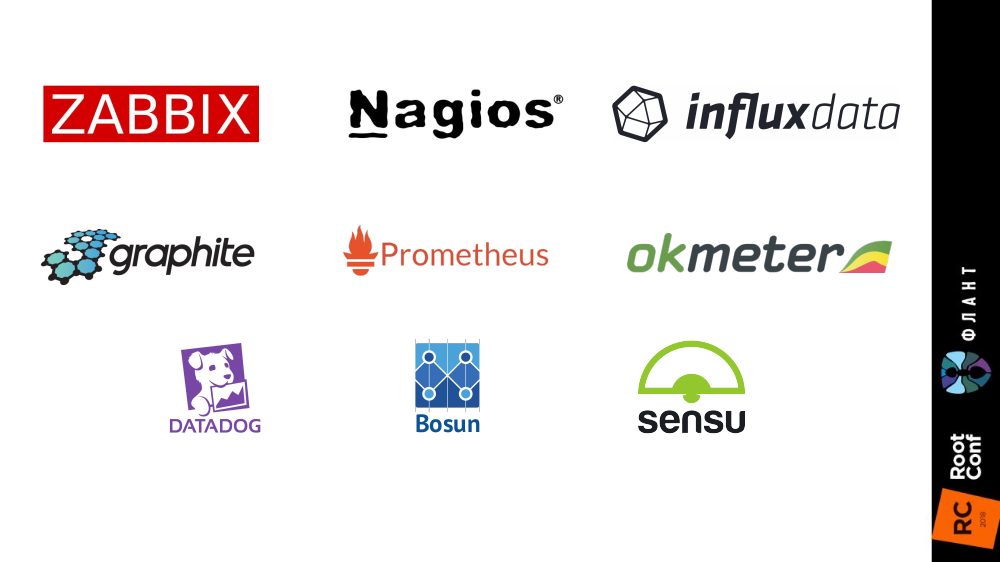
It would seem to take and install one of them - that's all, the question is closed. But practice shows that it is not. And that's why:
- Speedometer shows speed . If you measure the speed once a minute by the speedometer, then the average speed that we calculate based on this data will not match the odometer data. And if in the case of a car this is obvious, then when it comes to many, many indicators for the server, we often forget about it.
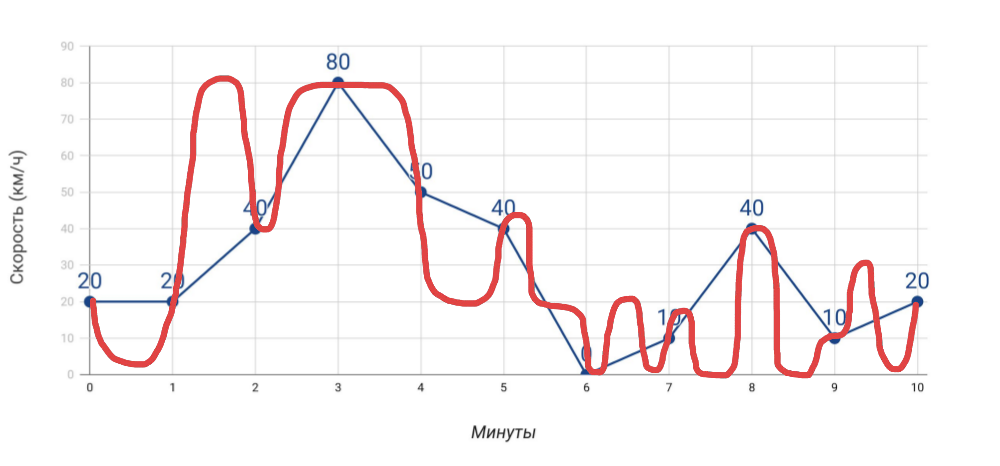
What we measure and how we actually went - More measurements . The more different indicators we get, the more accurate will be the diagnosis of problems ... but only on condition that these are really useful indicators, and not just everything that we managed to collect.
- Alerts . There is nothing difficult to send alerts. However, two typical problems: a) false positives occur so often that we stop responding to any alerts, b) alerts come at a time when it is too late (everything has already exploded). And to achieve in monitoring that these problems do not arise is true art!
Monitoring is a cake of three layers, each of which is critical:
- First of all, it is a system that allows you to pre-empt accidents , notify about accidents (if they were not managed to be prevented) and carry out a quick diagnosis of problems.
- What does that require? Accurate data , useful graphics (you look at them and understand where the problem is), actual alerts (come at the right time and contain clear information).
- And in order for all this to work, the monitoring system itself is needed.
Competently setting up a monitoring system that actually works is not an easy task, requiring a thoughtful approach to implementation, even without Kubernetes. And what happens with his appearance?
Specific monitoring in Kubernetes
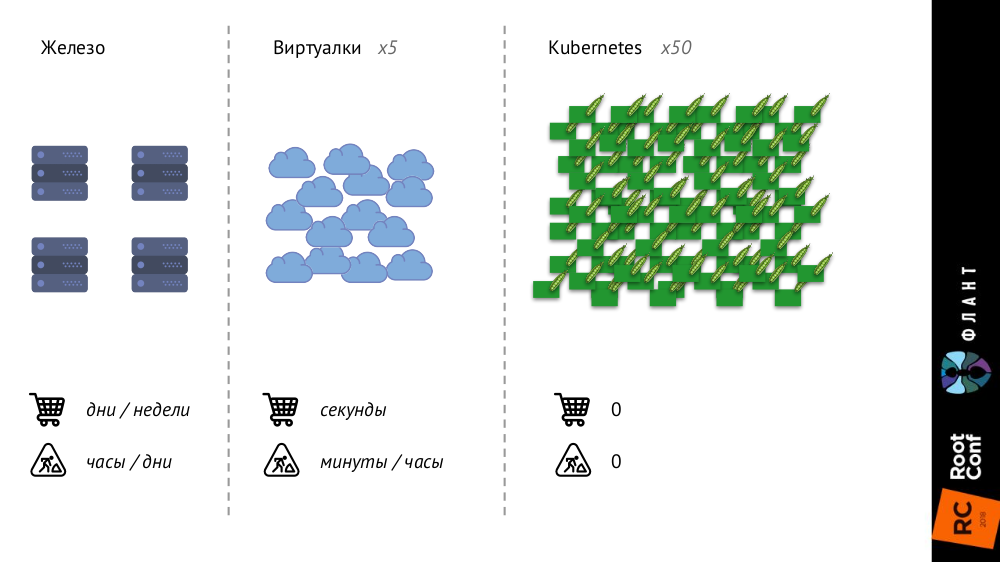
№1. Bigger and faster
With Kubernetes, things are changing, because the infrastructure is getting bigger and faster. If earlier, with ordinary iron servers, their number was very limited, and the process of adding was very long (it took days or weeks), then with virtual machines the number of entities increased significantly, and the time of their introduction into battle was reduced to seconds.
With Kubernetes, the number of entities has increased by an order of magnitude, their addition is fully automated (configuration management is necessary, because without a description, the new pod simply cannot be created), the entire infrastructure has become very dynamic (for example, at each deployment, the pods are removed and are created again).
What does it change?
- We basically stop looking at individual pods or containers - now we are only interested in groups of objects .
- Service Discovery becomes strictly mandatory , because the “speeds” are already such that we basically cannot start / delete manually new entities, as it was before, when new servers were bought.
- The amount of data increases significantly . If before metrics were collected from servers or virtual machines, now from pods, the number of which is much larger.
- The most interesting change I called the “ metadata routine ” and will tell about it in more detail.
I'll start with this comparison:
- When you give a child to kindergarten, they give him a personal box, which is assigned to him for the next year (or more) and in which his name is indicated.
- When you come to the pool, your locker is not signed and it is issued to you for one "session".
So, the
classic monitoring systems think that they are kindergarten , not a swimming pool: they assume that the monitoring object has come to them forever or for a long time, and give them lockers accordingly. But the realities in Kubernetes are different: the pod came to the pool (that is, it was created), swam in it (before the new deployment) and left (was destroyed) - all this happens quickly and regularly. Thus, the monitoring system must understand that the objects for which it monitors, live a short life, and must be able to completely forget about it at the right moment.
№2. Parallel reality exists
Another important point is that with the advent of Kubernetes, we simultaneously have two “realities”:
- The world of Kubernetes, in which there are namespaces, deployments, pods, containers. This world is complex, but it is logical, structured.
- The "physical" world consisting of a set (literally - heaps) of containers on each node.
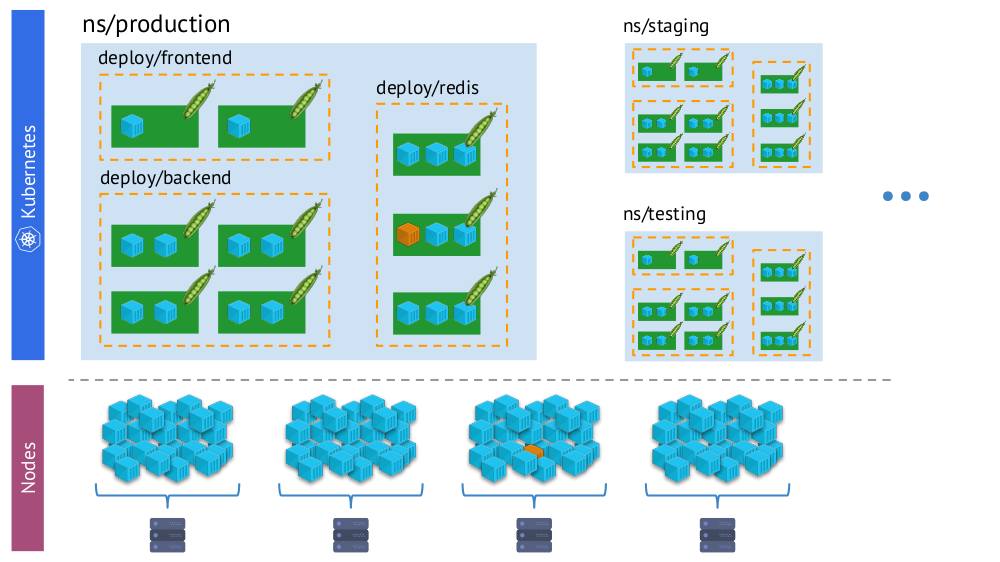 The same container in the “virtual reality” Kubernetes (above) and the physical world of nodes (below)
And in the process of monitoring, we need to constantly
compare the physical world of containers with the reality of Kubernetes . For example, when we look at some namespace, we want to know where all of its containers (or containers of one of its pods) are located. Without this, alerts will not be visual and easy to use - because it is important for us to understand what objects they report.
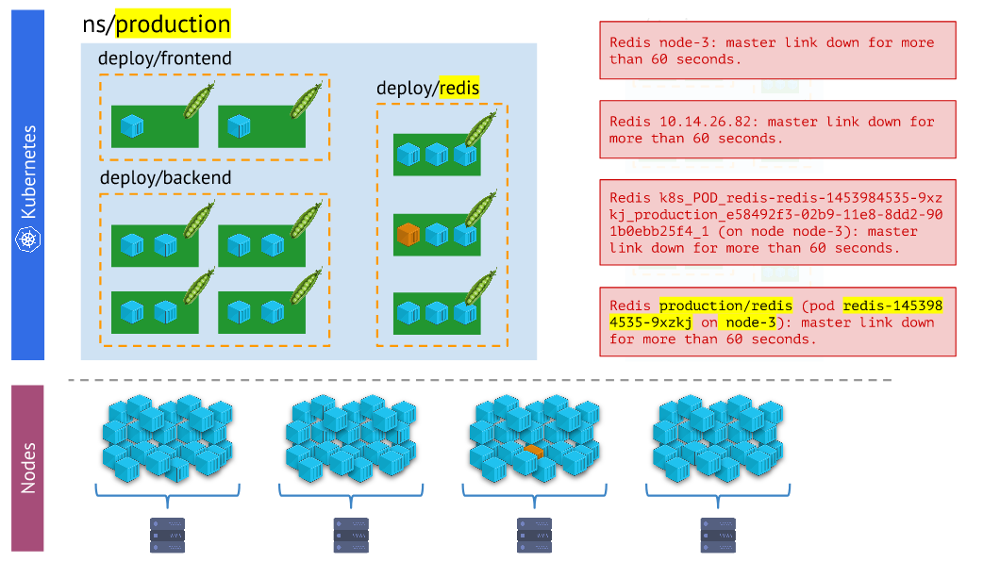 Different versions of alerts - the latter is clearer and easier to work than the restThe conclusions
 here are:
- The monitoring system should use Kubernetes built-in primitives.
- There are more than one realities: problems often happen not with a hearth, but with a particular node, and we need to constantly understand what kind of "reality" they are in.
- In one cluster, as a rule, there are several environments (besides production), which means that this needs to be taken into account (for example, do not receive alerts at night about problems on dev).
So, we have three necessary conditions for everything to happen:
- We understand what monitoring is.
- We know about its features, which and which features appear with Kubernetes.
- We are adopting Prometheus.
And now, in order to really work out, it remains only to make
a lot of effort
indeed ! By the way, why Prometheus? ..
Prometheus
There are two ways to answer the question about choosing Prometheus:
- See who and what uses Kubernetes to monitor.
- Consider its technical advantages.
For the first one, I used the survey data from The New Stack (from
The State of the Kubernetes Ecosystem e-book), according to which Prometheus is at least more popular than other solutions (and Open Source, and SaaS), and if you figure it out, it has a fivefold statistical advantage .
Now let's take a look at how Prometheus works, in parallel with how its capabilities are combined with Kubernetes and solve related challenges.
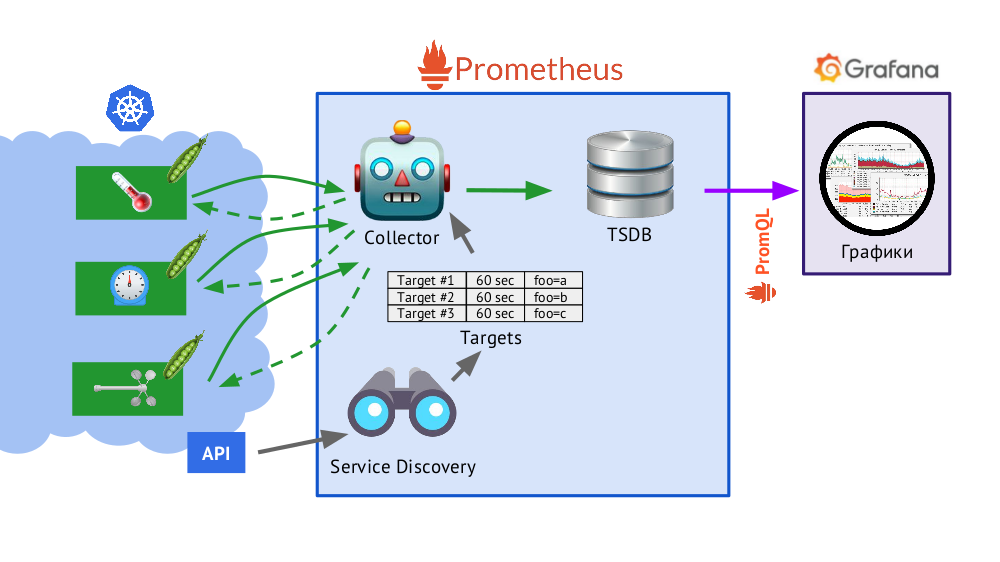
How does Prometheus work?
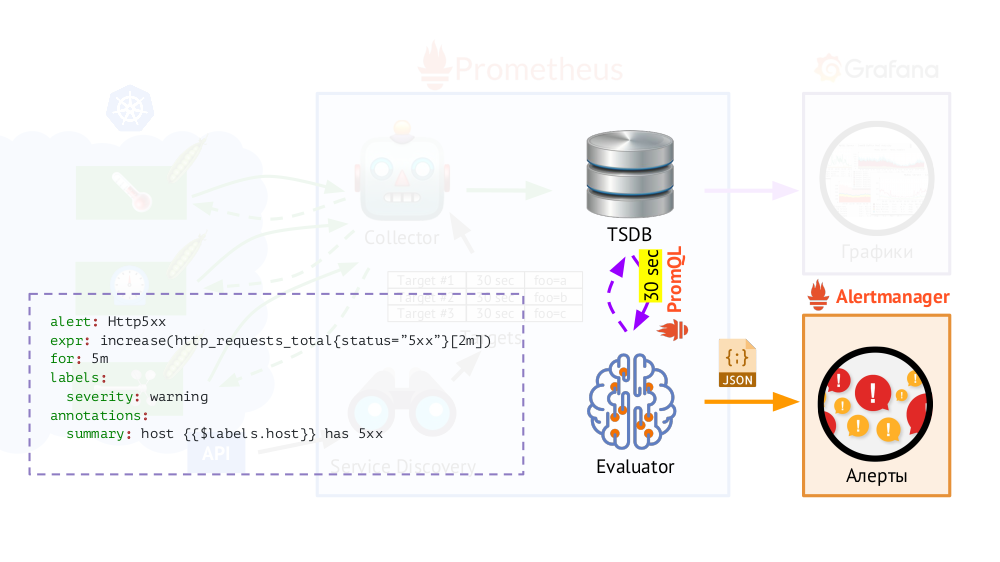
Prometheus is written in the Go language and is distributed as one binary file with everything you need embedded in it. The basic algorithm of his work is as follows:

- Collector reads the targets table , i.e. the list of objects to be monitored and the frequency of their polling (60 seconds by default).
- After that, the collector sends an HTTP request to each desired hearth and receives a response with a set of metrics - there may be one hundred, one thousand, ten thousand ... Each metric has a name, a value and labels .
- The resulting answer is added to the TSDB database, where the received time stamp and the labels of the object from which it was taken are added to the metric data.
In brief about TSDBTSDB is a time series database on a Go series that allows you to store data for a specified number of days and does it very efficiently (in size, memory, and I / O). The data is stored only locally, without clustering and replication, which is a plus (it just works and guaranteed) and a minus (there is no horizontal scaling of the storage), but in the case of Prometheus, the sharding is well done, the federation is more detailed about this further.
- The Service Discovery scheme presented in Prometheus is a service discovery mechanism that allows you to get out of the box (through the Kubernetes API) data for creating a table of goals.
What does this table look like? For each entry, the URL is stored in it, which is accessed to obtain metrics, the frequency of hits and labels.
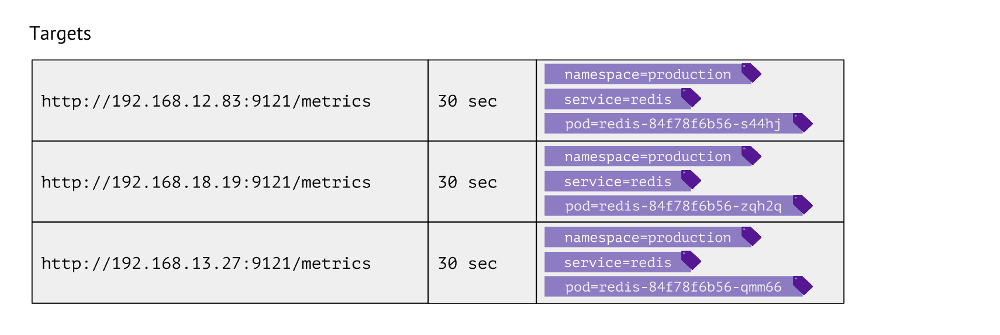
Labels are used for the very juxtaposition of Kubernetes and the physical worlds. For example, to find a pod with Redis, we need to have the values of namespace, service (used instead of deployment due to technical peculiarities for a particular case) and pod itself. Accordingly, these 3 labels are stored in the target table entries for Redis metrics.
These entries in the table are formed on the basis of the Prometheus config, which describes the monitoring objects: in the
scrape_configs section,
scrape_configs defined, which indicate by which labels to search for objects to be monitored, how to filter them, and which labels they should record.
What data in Kubernetes to collect?
- Firstly, the master in Kubernetes is rather complicatedly arranged - and the state of his work is critical to monitor (kube-apiserver, kube-controller-manager, kube-scheduler, kube-etcd3 ...), and with reference to the cluster node.
- Secondly, it is important to know what is going on inside Kubernetes . To do this, we get data from:
- kubelet - this component Kubernetes is running on each node of the cluster (and is connected to the K8s wizard); cAdvisor is built into it (all metrics by container), and also information about connected Persistent Volumes is stored in it;
- kube-state-metrics - in fact, it is the Prometheus Exporter for the Kubernetes API (it allows you to get information about objects that are stored in Kubernetes: pods, services, deployments, etc.; for example, without it we will not know container or delivery status;
- node-exporter - provides information about the node itself, the basic metrics for the Linux-system (cpu, diskstats, meminfo, and so on ).
- Further, Kubernetes components , such as kube-dns, kube-prometheus-operator and kube-prometheus, ingress-nginx-controller, etc.
- The next category of objects for monitoring is the software itself , launched in Kubernetes. These are typical server services like nginx, php-fpm, Redis, MongoDB, RabbitMQ ... We ourselves make it so that when you add certain labels to the service, it automatically begins to collect the necessary data, which creates the current dashboard in Grafana.
- Finally, the category for everything else is custom . Prometheus tools allow you to automate the collection of arbitrary metrics (for example, the number of orders) by simply adding one label
prometheus-custom-target to the service description.

Charts
The data obtained
(described above) are used to send alerts and create graphs. We draw graphs with
Grafana . And an important “detail” here is
PromQL , a query language in Prometheus, which integrates well with Grafana.
It is quite simple and convenient for most tasks
(but, for example, it is already inconvenient to make joines in it, but you still have to) . PromQL allows you to solve all the necessary tasks: quickly select the necessary metrics, compare values, perform arithmetic operations on them, group, work with time intervals and much more. For example:

In addition, Prometheus has a query executor (
Evaluator ), which, using the same PromQL, can access the TSDB at specified intervals. Why is this? Example: start sending alerts in those cases if we have, according to the available metrics, 500 error on the web server during the last 5 minutes. In addition to the labels that were in the request, the Evaluator adds additional data (as we configure) to the
alert data , after which they are sent in JSON format to another component of Prometheus -
Alertmanager .
Prometheus periodically (once every 30 seconds) sends alerts to Alertmanager, which deduplicates them (upon receiving the first alert, it will send it, and subsequent ones will not be sent again).
 Note : We do not use Alertmanager at our place, but send data from Prometheus directly to our system, with which our attendants work, but this is of no fundamental importance in the general scheme.
Prometheus in Kubernetes: the whole picture
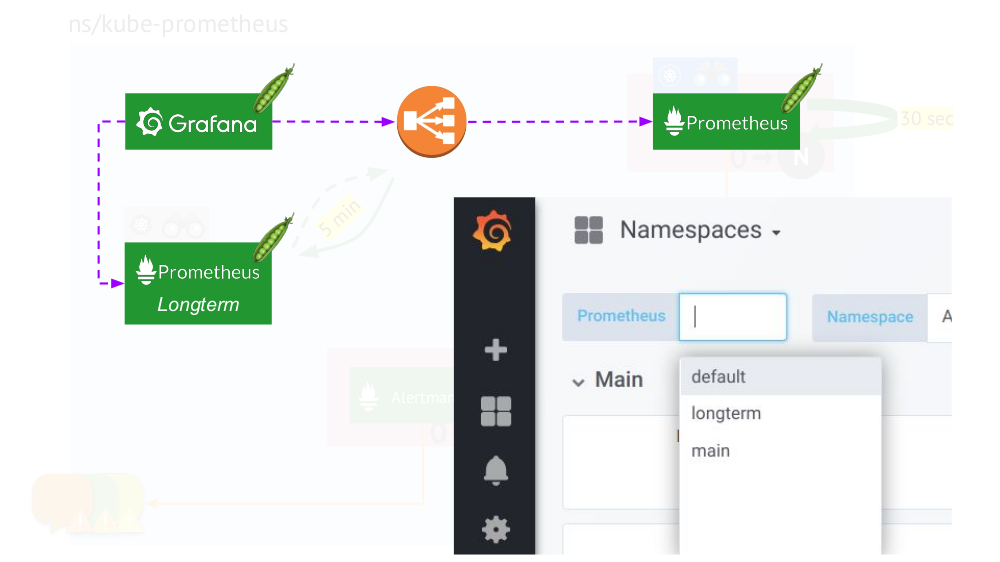
Let's now look at how this whole bunch of Prometheus works within Kubernetes:
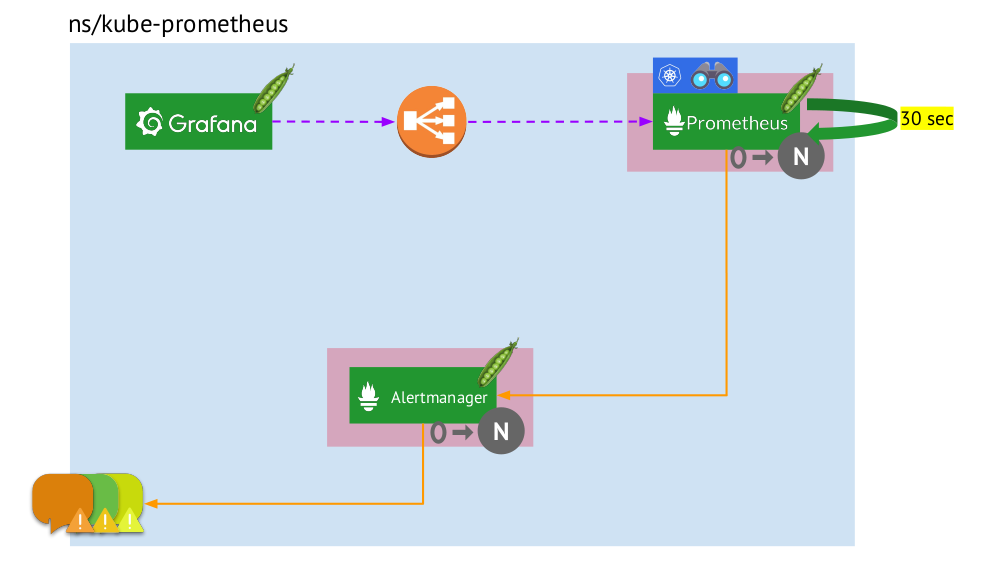
- Kubernetes has its own namespace for Prometheus (here and in the illustration it is
kube-prometheus ) . - This namespace hosts a pod with an installation of Prometheus, which every 30 seconds collects metrics from all targets obtained by Service Discovery in a cluster.
- It also hosts a pod with Alertmanager, which receives data from Prometheus and sends alerts (to mail, Slack, PagerDuty, WeChat, third-party integration, and so on ) .
- Prometheus is faced with a load balancer — the usual Service at Kubernetes — and Grafana calls Prometheus through it. To ensure fault tolerance, Prometheus uses several pods with Prometheus installations, each of which collects all the data and stores it in its TSDB. Through the balancer Grafana falls on one of them.
- The number of pods with Prometheus is controlled by the setting of StatefulSet - we usually make no more than two pods, but you can increase this number. Similarly, Alertmanager is deployed through StatefulSet, for fault tolerance of which at least 3 pods are required (since quorum is needed to make decisions about sending alerts.)
What is missing here? ..
Federation for Prometheus
When collecting data every 30 (or 60) seconds, the place for storing them is very fast, and even worse, it requires a lot of computing resources (when receiving and processing such a large number of points from the TSDB). But we want to store and be able to download information for
large time intervals . How to achieve this?
It is enough to add
one more Prometheus installation (we call it
longterm ) to the general scheme, in which Service Discovery is disabled, and in the target table - the only static entry leading to the main Prometheus (
main ).
This is possible thanks to federation : Prometheus allows you to return the latest values of all metrics in one query. Thus, the first installation of Prometheus still works (it addresses every 60 or 30 seconds, for example) to all targets in the Kubernetes cluster, and the second one receives data from the first one every 5 minutes and stores them to be able to watch data for a long period ( but without deep detail).
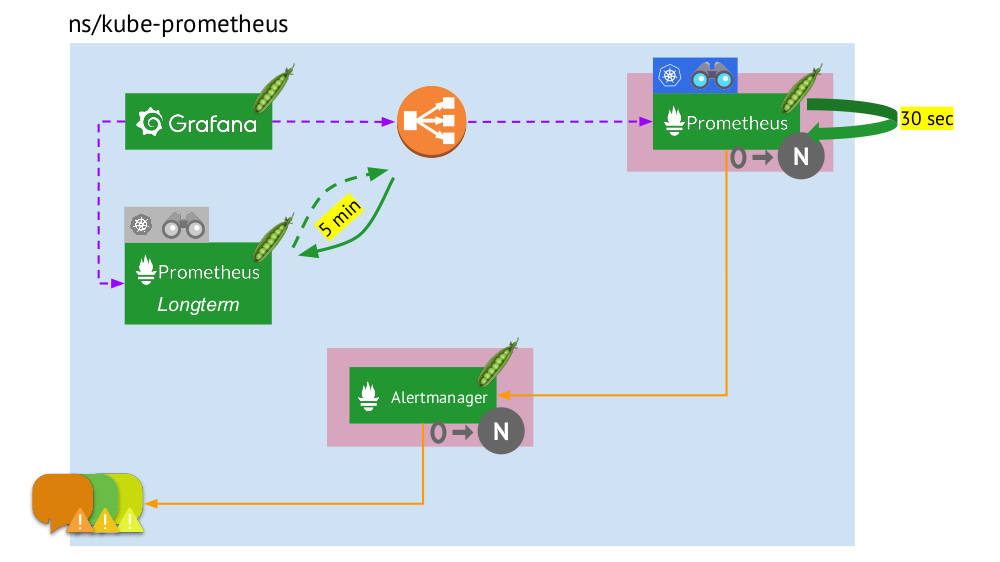 The second installation of Prometheus does not need Service Discovery, and the goal table will consist of one line.
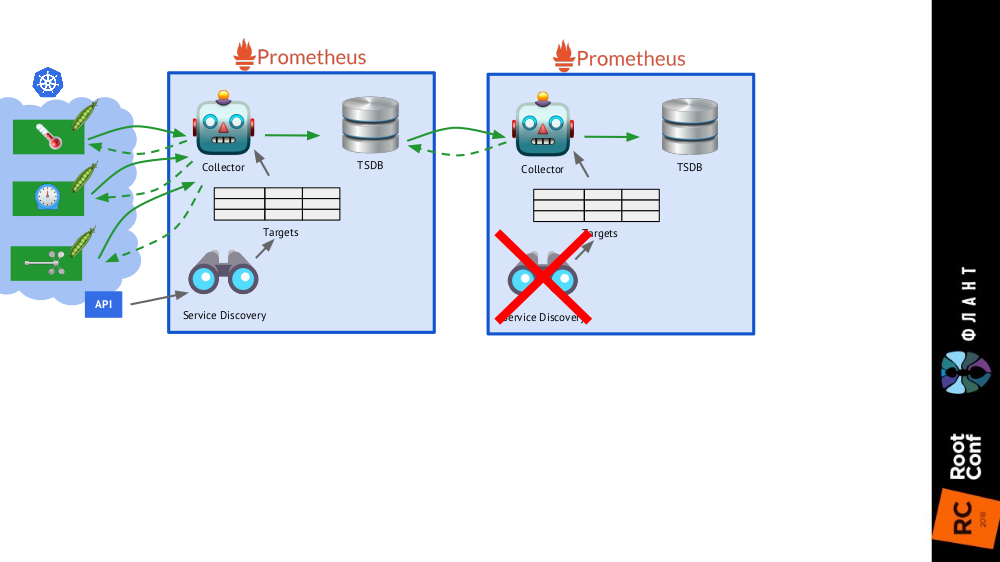 The picture as a whole with Prometheus installations of two types: main (above) and longterm
The final touch is
connecting Grafana to both Prometheus installations and creating dashboards in a special way so that you can switch between data sources (
main or
longterm ). This requires using the template mechanism to substitute the
$prometheus variable instead of the data source in all panels.
What else is important in the charts?
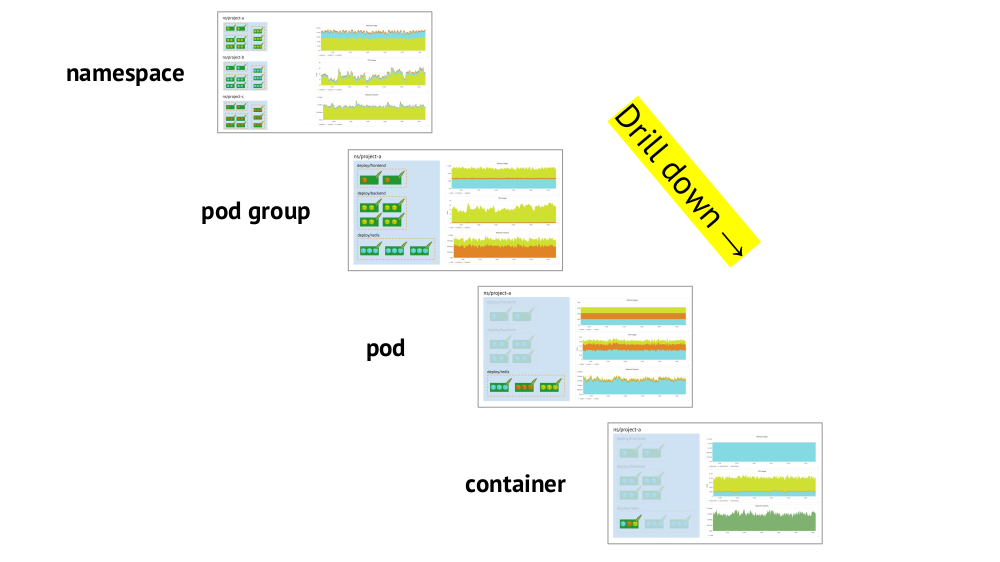
Two key points to consider when organizing schedules are the support of Kubernetes primitives and the ability to quickly
drill down from the overall picture (or a “lower” view) to a specific service and vice versa.
About the support of primitives (namespace, pods, etc.) has already been said - this is a necessary condition in principle for comfortable work in the realities of Kubernetes. Here is an example about drill down:
- We look at the graphs of resource consumption by three projects (ie, three namespaces) - we see that the main part of the CPU (or memory, or network, ...) falls on project A.
- We look at the same graphics, but for the services of project A: which of them consumes the most CPU?
- Go to the schedules of the desired service: which pod is “to blame”?
- Go to the charts of the desired pod: which container is “to blame”? This is the desired goal!
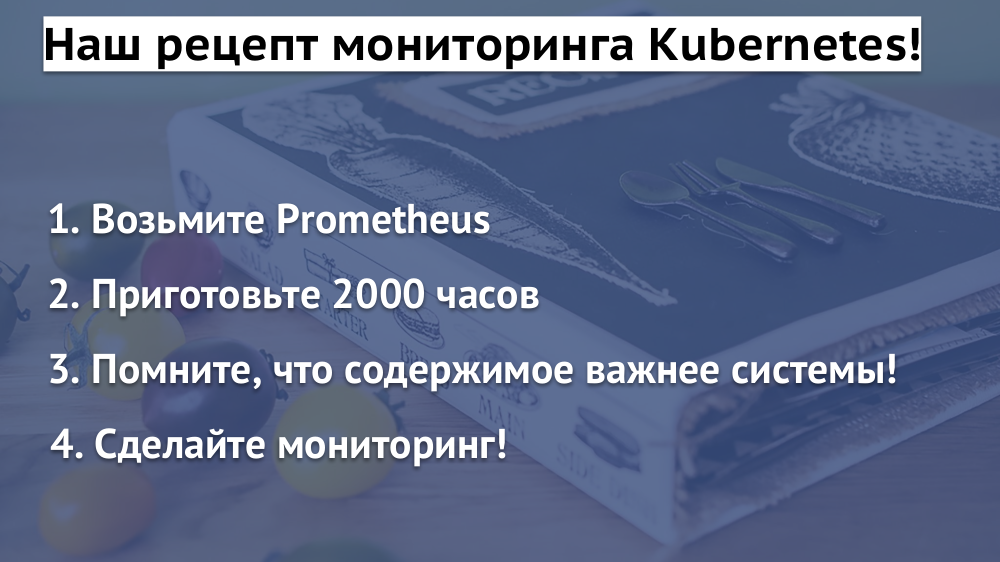
Summary
- Accurately formulate for yourself what monitoring is. (Let the "three-layer cake" serve as a reminder of this ... as well as that it is not easy to bake it competently even without Kubernetes!)
- Remember that Kubernetes adds mandatory specifics: grouping targets, service discovery, large amounts of data, metadata routine. And:
- Yes, some of them magically (out of the box) are solved in Prometheus;
- however, there remains another part, for which you need to independently and thoughtfully follow.
And remember that the
content is more important than the system , i.e. The correct graphs and alerts are primary, not Prometheus (or any other similar software) as such.
Video and slides
Video from the performance (about an hour):
Presentation of the report:
PS
Other reports on our blog:
You may also be interested in the following publications: