Introduction
Hello! Today we will talk about real-time monitoring of
Atlassian products.
First, let's define what monitoring is and why it is necessary for
Atlassian products.
Program monitoring is used to track the progress and results of the program. In other words, it is a process that can display real-time information about the status of a software product in real time.
When can this be useful for
Atlassian products?
Consider examples:
- You want to know how a product or plugin update affects system performance;
- You want to know about the state of iron and memory under various conditions and at certain points in time. For example, how increasing the number of users or changing the time of day affects the system;
- You want to see how actively the system is being used. For example, the total number of tasks in Jira or in 1 hour;
- You want to put a reminder on the expiration date of the license;
- You would like to know the amount of disk space used to store documents.
I would also like to not only receive information in a prepared form, but also be able to send notifications if something happens under an erroneous scenario. This is where
Prometheus and its exporters will help us with
Atlassian products.
Solution Architecture
Prometheus is a tool for simultaneous monitoring of tens of thousands of services. The
Prometheus server reads target objects at intervals that you define to collect metrics, and stores them in a time series database. A pull model is used to collect metrics. In addition, there is the
Alert Manager component, which can send notifications to various channels, if a specific rule based on metrics has been triggered. Detailed information in Russian can be found
here and
here .
Prometheus exporter is an agent that collects metrics directly from the entity (the server as a whole or a specific application) that needs to be monitored.
Prometheus has a lot of room for expansion, so exporters are available for most popular applications.
[jira | confluence | bitbucket | bamboo] _exporter works as follows:
- obtains data from the product database;
- obtains data using standard Java API;
- adds filters to HTTP requests;
- collects JMX metrics.
An example of a quick installation of
Prometheus / Grafana in
Docker is implemented by
Stefan Prodan and is available at this
link .
Installation and configuration of the exporter
After you install the
plugin , the link for getting the metrics immediately becomes available to you:
baseUrl / plugins / servlet / prometheus / metrics . It is also possible to configure the security key.
Next, in
prometheus.yml you need to add the address at which to receive the metrics.
For example, for
Jira :
- job_name: 'jira' scheme: https # change to http if don't you have https metrics_path: '/jira/plugins/servlet/prometheus/metrics' static_configs: - targets: ['myhost:2990'] # Jira host and port you serve
Integration is complete, you can use.
Metrics and query examples
You can see the list of all metrics in the plugins documentation:
Jira ,
Confluence ,
Bitbucket ,
Bamboo .
Request examples:
- Uptime:
jvm_uptime_gauge{job="jira"}
- Server request time:
(sum(rate(jira_request_duration_on_path_sum[1m])) by (path)) / (sum(rate(jira_request_duration_on_path_count[1m])) by (path))
- Total number of tasks:
jira_total_issues_gauge
- Number of views of dashboards:
sum(increase(jira_dashboard_view_count[1h]))
Read more about building queries
here .
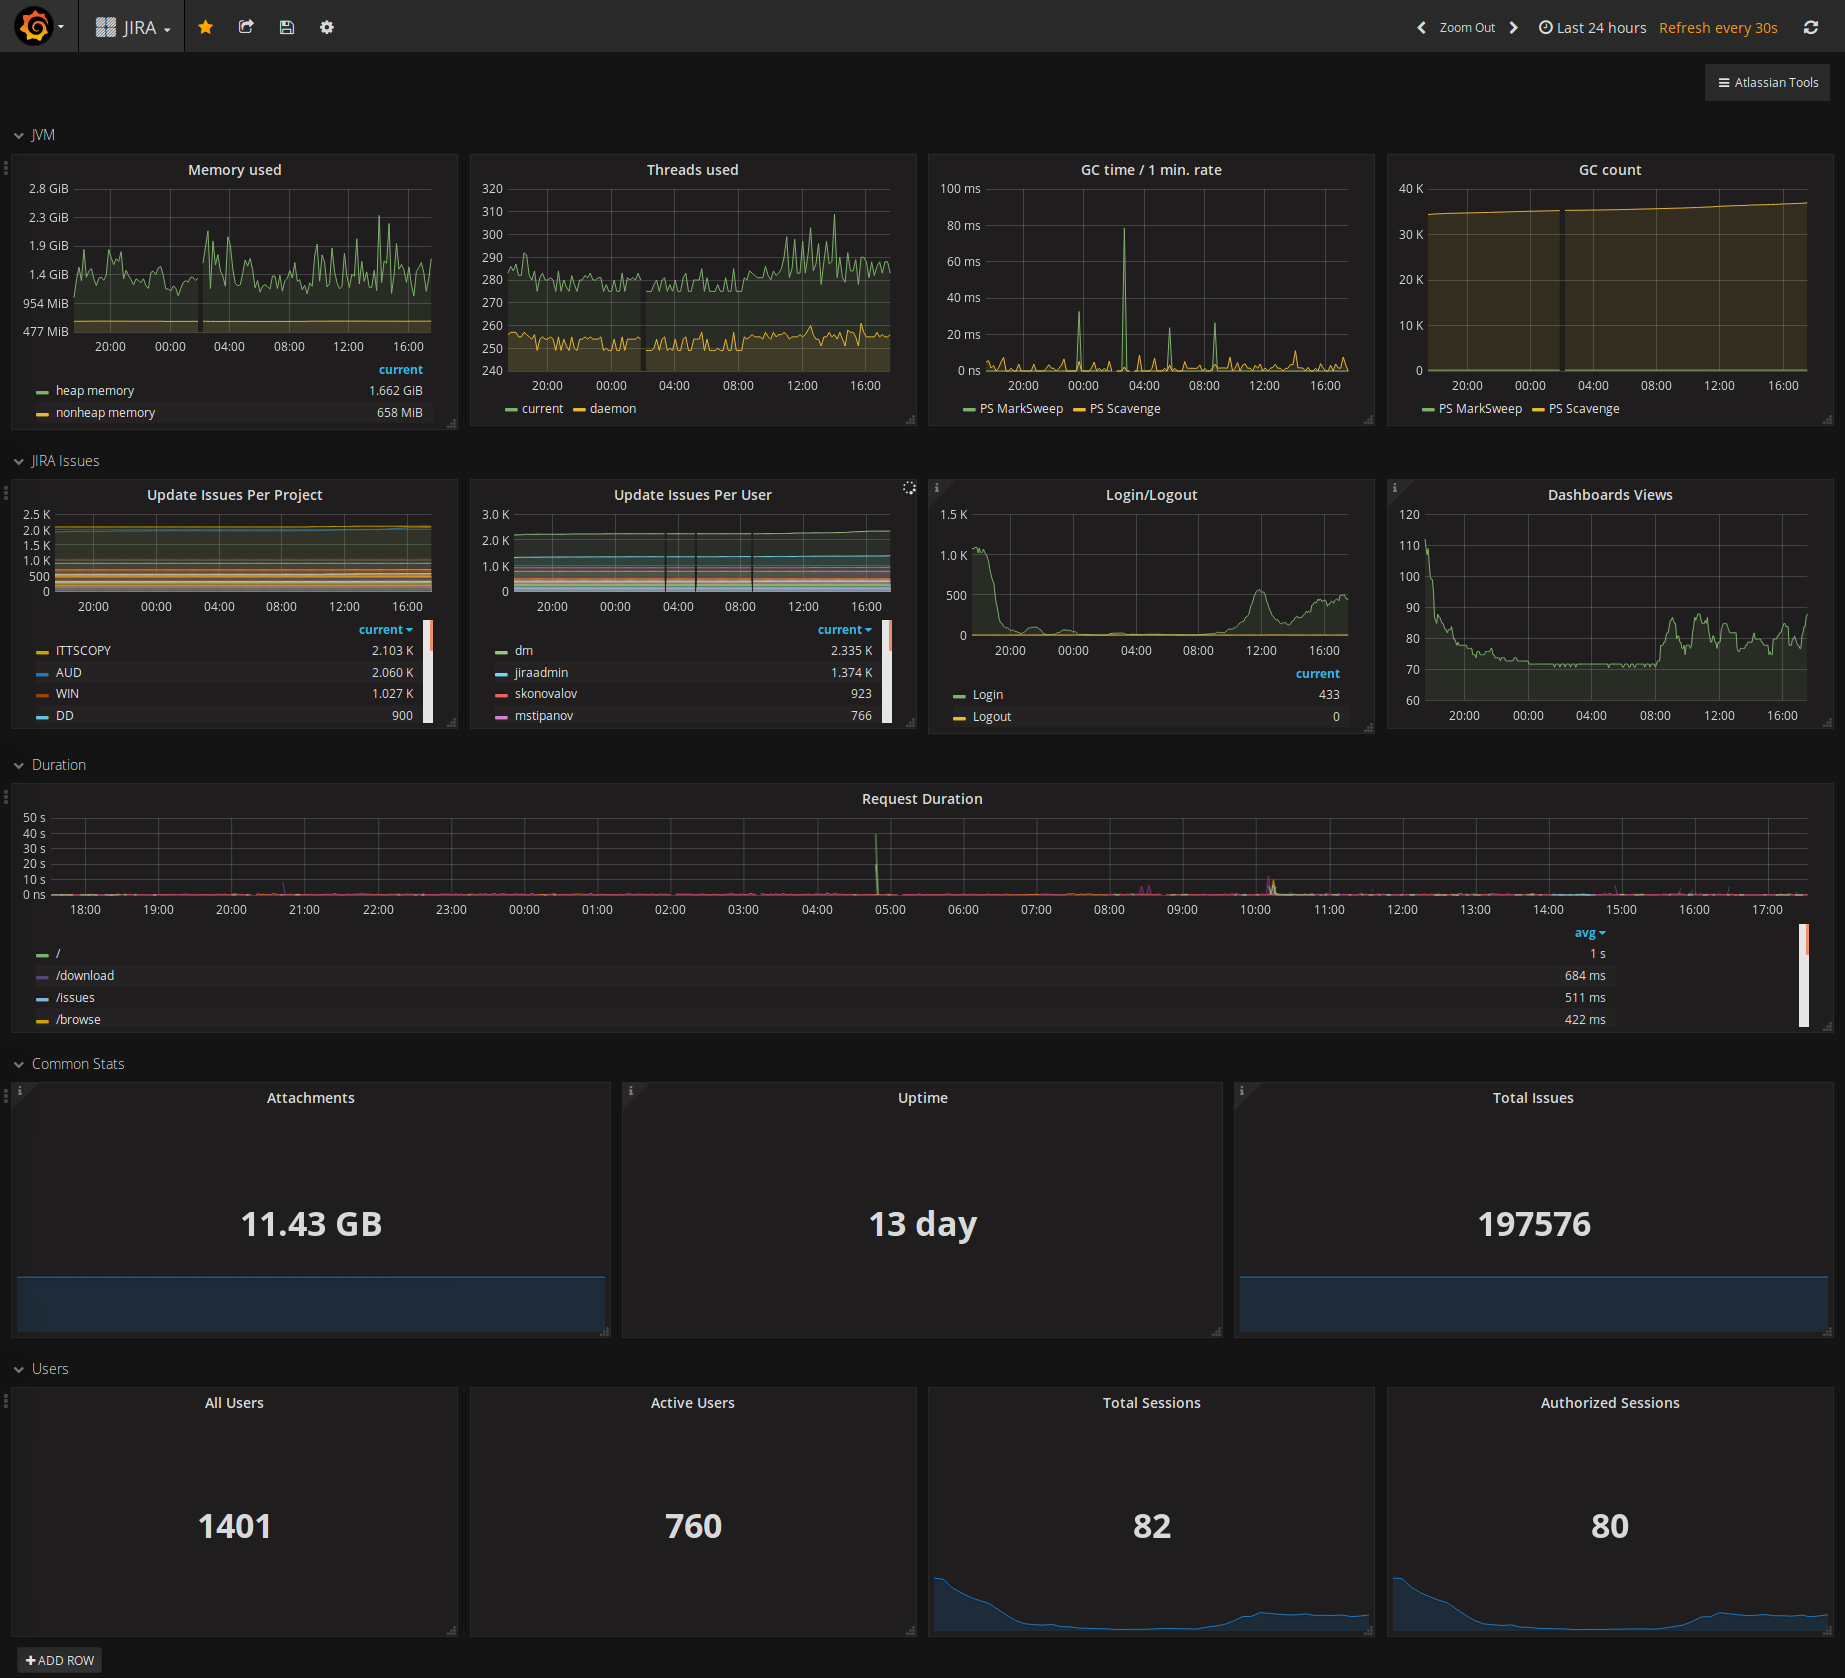
Grafana dashboards
You can use
Grafana as a third-party component for visualizing metrics stored in a
Prometheus time series database. There are several ready-made implementations on the official
site . For example, dashboards for
Jira can be found at this
link .
Features
I plan to add the ability to define custom metrics using
Groovy , as well as full support for
Service Desk . Thus, you can add custom metrics not only for the products themselves, but also for other plug-ins.
All
exporters are open and actively developing. If you have ideas for improvement or expansion, please create tasks (
Jira ,
Confluence ,
Bitbucket ,
Bamboo ) and / or make pull-requests.
Conclusion
If your
Atlassian installations are quite large, and you need to ensure continuous operation, monitoring is definitely needed. And how - decide for yourself.
Prometheus , as one of the options that, no doubt, will make your life easier.
Thanks for attention!