Automation ... Today you will not surprise anyone with this word. Every year more and more various programs and mechanisms are created to help people in their work. Some organizations are better equipped, others - worse, but without exception, they strive to reduce production costs, increase profits and improve the quality of the final product. Not spared this trend and the field of medicine. Along with the number of diagnostic centers, the demand for corresponding software is also growing. Some centers use LIS (laboratory information system), others use RIS (radiological information system), while others use the entire IIA (medical information system), although there are those that work in the old way with an omnipotent aunt. patient - which office to keep your way.
Let us leave alone our native bureaucratic hell, which has spoiled blood for more than one generation of patients, and will return to the good of modern medicine - to the IIA. We want to talk about the internal structure of the modern medical system, and this article is the first of a series of publications on this topic.
The IIA consists of many directions: organization of the flow between workplaces within the company, specialized workplaces for medical personnel, workplaces for other employees, reports, work schedule of staff, telephony (call center), telemedicine, online recording, personal account of the patient, medical maps, storage of medical data, collection of results from diagnostic equipment (including automated), their interpretation and visualization, hospital, emergency medical care.
At this stage, we want to focus on the issue of storage of medical data.
The result of each examination is a study report completed by a medical professional. When studying it, it was found that all data can be divided into three categories:
- measurements;
- comments;
- other (graphs, charts, various images). We will consider them in the following articles.
Before turning to a detailed review of dimensions and comments, let us turn our attention to another question: what unites these entities with each other?
Anatomy
Measurements and comments are intended to describe the object under study -
anatomy . However, our essence of anatomy has a broader meaning than anatomy in a biological sense. It includes parts of the body (head, neck, etc.), organs (liver, heart, etc.), tissues, waste products of the body (urine, feces), bones, fluids, which are the activities of any organs (breast milk, the secret of the prostate gland), various neoplasms, mucous membranes, microorganisms and so on. After listing all of these elements, it may seem that the anatomy looks like a landfill, but this is more like a box with things packed in boxes. We can shift the items in it and group them among themselves for any reason. So anatomy can be viewed in different planes. On the one hand, all objects are included in different systems - a functional approach. For example, the heart and the renal artery - in the circulatory, pancreas - in the digestive. On the other hand, it is possible to consider data in a structural section. So the heart is located in the chest, and the renal artery and pancreas - in the abdominal cavity. This is how the anatomy hierarchy emerges.
We must not forget that various metamorphoses can occur with a human body over the course of a lifetime: organ removal operations, pregnancy, the appearance of tumors, etc. Therefore, for some anatomies, a special status is needed (with values: yes, not visualized, deleted); for others - the possibility of adding them to the patient’s medical history.
By and large, anatomy can act not only as what is described, but also as a clarification of the place (localization) in which something is located or where biological material is taken from. For example, a hernia is at the level of C5-6 vertebra (cervical spine), and Staphylococcus aureus can be found in the throat, nose, or right ear.
Comments
Comments are perhaps the simplest essence, since it is a set of text phrases describing the patient's complaints, the condition of the object being investigated, the diagnosis, the recommendations for treatment. Most importantly, the comment allows you to express your opinion to the doctor to provide a more complete picture of other colleagues and the patient. In total, there were three types of comments: complaints, comments, conclusion.
Measurements
Measurements help establish the state of the object being studied. If the measurement result can be selected from a set of text values, this is an
enumerated dimension . They can, for example, describe the state of the tongue, the color of urine, clarify the type of blood flow in the artery, confirm or deny the presence of any bacteria or antibodies. Each variant of the value of the enumerated dimension may relate to the norm or pathology, but it may not be relevant to these two types. The latter option is possible if the “normality indicator” depends on some factor.
For example, when examining a pediatrician, the Bauer reflex is defined - the crawling phenomenon. It is observed in newborns from the first days of life. A baby lying on its belly makes crawling movements (so-called spontaneous crawling). If we place the palm at his feet, the movements become more active, the hands are connected to the crawl, and the child begins to push off from the support. To evaluate the reflex, several options are used: good, sluggish, absent. The extinction of the phenomenon occurs by 3-4 months. Therefore, what is considered normal in one age category may turn out to be a pathology in another.

Another case where the enumeration value can not be attributed either to the norm or to the pathology - blood group and Rh factor.

In other words, for enumerable measurements, we identified three types: norm, not norm, not specified.
Another customizable parameter for enumerators is the default flag. It can be installed only for one of the options. We cannot automatically substitute a value with the “norm” type when visualizing a measurement in a template, since there may be no such value at all, or there may be several of them, or it will be necessary to show a variant with a different type.
Not all measurements result is determined by the text value. To indicate the size of organs, heart rate (HR), blood flow velocity, the quantitative presence of certain substances and other things,
numerical measurements are used . In this case, the
reference (reference) intervals , which are a range of values, within which the result of the study is considered acceptable, act as the “indicator of normality”.
Why is the use and display of reference intervals in the template so important? First, the range of normal values for different groups of people may differ significantly from each other. Such differences are influenced by such indicators as: age, sex, height, weight, phase of the cycle, pregnancy, smoking (sometimes the number of years of smoking is taken into account), time of sampling.
It's no secret that the physiological processes in children and adults proceed in different ways. Although it is not entirely true to single out the normal ranges for children and adults without clarification. At each age, there are some changes in the body that can significantly affect certain measurement results. Because of this, some measurements have an impressive number of reference intervals.
For example, heart rate. To pump blood to a small heart of a child will require much more cuts than a teenager or an adult. Heart rate ranges for different ages:
- first month of life - 105-125 beats / min;
- from 1 month to 1 year - 100-160 beats / min;
- within 1 year - 110-120 beats / min;
- 2-5 years - 100-110 strokes / min;
- 6-7 years - 80-100 beats / min;
- 8-9 years - 68-108 beats / min;
- 10-11 years old - 60-100 beats / min;
- 12-14 years old - 55-95 beats / min;
- 15-29 years old - 60-95 beats / min;
- after 30 years - 60-90 strokes / min.
There are measurements where several indicators are taken into account. For example, for alkaline phosphatase, both the patient's age and gender are taken into account:
- for a newborn baby - 40-250 U / liter;
- from 7 months to 1 year - 10-449 U / liter;
- 1-3 years - 40-281 U / liter;
- 4-6 years old - 40-269 U / liter;
- 7-12 years old - 40-300 U / liter;
- for men from 13-17 years old - 40-390 U / liter;
- for men from 18 years old - 40-130 U / liter;
- for women 13-17 years old - 40-187 E / liter;
- for women from 18 years old - 35-105 U / liter.
Sex has the greatest effect on hormone analyzes. For example, luteinizing hormone (LH). For men:
- 1-5 years - 0.0-1.3 IU / liter;
- 6-10 years - 0.0-1.4 IU / liter;
- 11-13 years old - 0.1-7.8 IU / liter;
- 14-17 years old - 1.3-9.8 IU / liter;
- from the age of 18 - 1.7–8.6 IU / liter.
With women harder:
- 1-5 years - 0.0-0.5 IU / liter;
- 6-10 years - 0.0-3.1 IU / liter;
- 11-13 years - 0.0-11.9 IU / liter;
- 14-17 years old - 0.5-41.7 IU / liter;
- 10-59 years, depending on the phase of the cycle, the values differ: the follicular phase is 2.4-12.6 IU / liter, ovulatory - 14.0-96.0 IU / liter, luteic - 1.0-11.4 IU / liter;
- from 49 years old (postmenopause) - 7.7-59.0 IU / liter.
Due to the physiological characteristics of each female body, it was decided to display all phases of the cycle in the template (each on a separate line).

Secondly, the results of the survey can be issued on the forms, which indicate the ranges that do not correspond to the banal age or sex. Most often, this situation occurs with the results of children's blood tests, which can be issued in clinics on letterheads with adult standards. In this case, the normal indicators for children are perceived by parents as a pathology, based on the norms indicated on the form. When studying their results, an adult patient may raise an unnecessary panic or not notice a potential threat to health.
Thirdly, in different medical institutions, reference intervals for the same measurement may differ from each other. This situation is typical for laboratory diagnosis. The reason is simple: labs can use different reagents and analyzers for analysis. Each reagent and analyzer has documentation that lists the performed analyzes and indicates the reference intervals for them.
Prothrombin analysis of INR (blood clotting index) is an anti-example. Regardless of reagents and analyzers, the result within the same sample should always be the same. In addition to the INR, there are three more ways to determine prothrombin: prothrombin time (PTV), Kvik prothrombin level and prothrombin index. However, only the INR gives stable and accurate results, which allows for better treatment of patients who are prescribed blood thinners (anticoagulants). The INR value is calculated as the ratio of the patient's PTV to the standard PTV and is raised to the MICH degree. In turn, the MICH is an international sensitivity index, which shows the activity of this reagent (thromboplastin) in relation to a standard sample. This indicator is entered into the analyzer. People who take indirect anticoagulants (usually on the basis of warfarin) do analysis constantly to regulate the rate of the drug being taken. Thus, the chance of a blood clot or the development of bleeding in the event of severe blood thinning is reduced. No less important is this analysis for pregnant women. During pregnancy, the third circle of blood circulation appears - the uteroplacental. There is a decrease in prothrombin time and an increase in the indicator of INR (tends to the upper limits of the norm). If the indicator of INR does not meet the standards, then it gives up more often three times per trimester, and a special course of treatment may be prescribed, since a deviation from the norm signals the risk of spontaneous abortion.
For some reference intervals you can find additional explanations -
interpretations . Each interpretation consists of two numerical values (minimum and maximum) and a text explanation of this range (a kind of personal comment on the measurement).
For example, in the study of urine is determined by acidity. The normal value ranges from 4.8 to 7.4 pH. If the result of the study falls within the range:
- 1.0-5.4 pH, then urine is considered acidic;
- 5.5-5.9 pH - slightly acidic;
- 6.0-7.5 pH - neutral;
- 7.6-8.0 pH - slightly alkaline;
- 8.1-9.9 pH - alkaline.
An example of functional diagnostics is the electrical axis of the heart (EOS), determined during a resting ECG. The normal value is from 0 to 89 degrees. Interpretations:
- from -30 to -1 degrees - deviation to the left (for example, due to left ventricular hypertrophy);
- 0-29 degrees - horizontal position;
- 30-69 degrees - normal position;
- 70-89 degrees - vertical position;
- 90-180 degrees - deviation to the right (for example, due to right ventricular hypertrophy or pulmonary embolism).

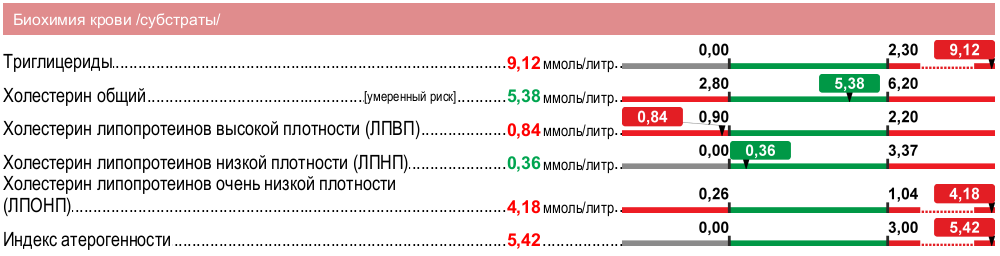
Reference interval - the scale on which the minimum and maximum values are marked. In most cases, a red-green-red scheme is suitable for displaying a range of values. For example, the above-mentioned HR, LH, urine acidity and EOS. There are measurements where the result of the survey can not be less than the minimum value of the interval. Therefore, for the left side of the interval, it is better to use gray. For example, creatinine or glucose in the urine. The minimum value for these measurements is zero. So we identified two
color schemes for the
reference intervals : red-green-red (KPC) and gray-green-red (SZK).
We noted another type of measurement - double numeric. They are used in the study of urine. The reason for the appearance of such results is the method of their measurement. The laboratory assistant places the glass in a microscope and counts the number of items in the field of view. Then the glass moves and the counting takes place again. And so several times. After that, the laboratory employee enters the range from minimum to maximum in the protocol. For example, an analysis of the number of red blood cells in urine sediment is performed. If the laboratory assistant counted 5, 3, and 9 red blood cells, then the form will say “3–9 pieces in full capacity”.
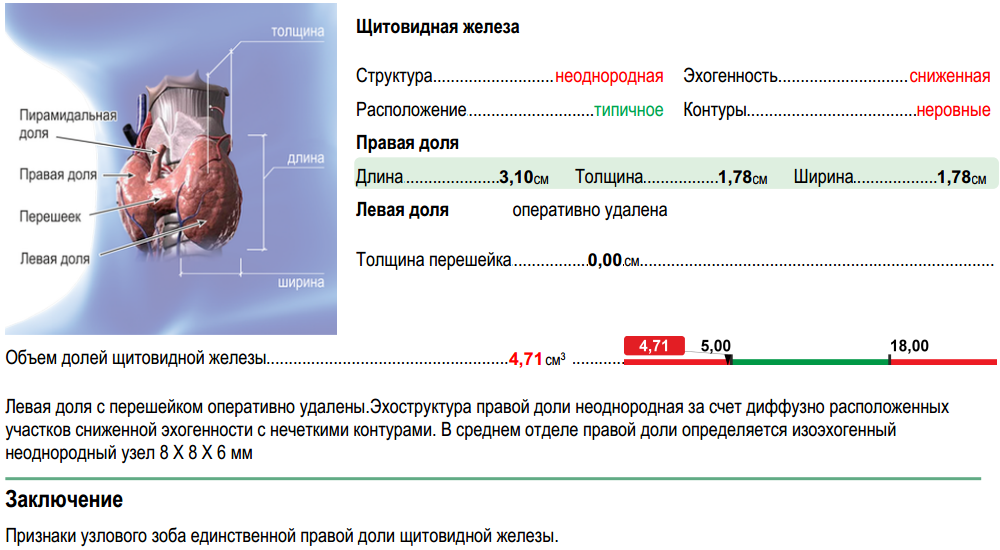
There are dimensions that do not make sense to analyze separately from each other. We have combined them into a
group of measurements . For example, systolic blood pressure and diastolic blood pressure. Individually, they are of little value. The dimensions of the spleen (length, thickness, width), the size of the lobes of the thyroid gland, etc. can also be attributed to such measurements. Groups allow you to connect with each other not only measurements attached to one anatomy (right thyroid lobe, spleen, etc.), but also to different ones. For example, measuring the diameter of the common carotid artery on the right (anatomy is the right common carotid artery) and the diameter of the common carotid artery on the left (anatomy is the left common carotid artery) or visual acuity in the far field for the right and left eyes (respectively the right eyeball and left eyeball ).
Finally, I would like to present one of the research templates, namely, an ultrasound of the thyroid gland. Here there is a beautiful picture, anatomy, and measurements are different, and groups of measurements with comments of two types. How did we do it? We will tell next time. See you!