In this article, we would like to talk about new features in Power BI Desktop, which include improved synchronization of slicers (filters), the use of all fields and measures for drilling in reports.
Expansion of detail in reports
In the May update, the drilling function can use any fields and work with measures, which will allow you to save the current filter settings while detailing the report.
We assume that you have a report with two pages: “Page Source” and “Page Target”.
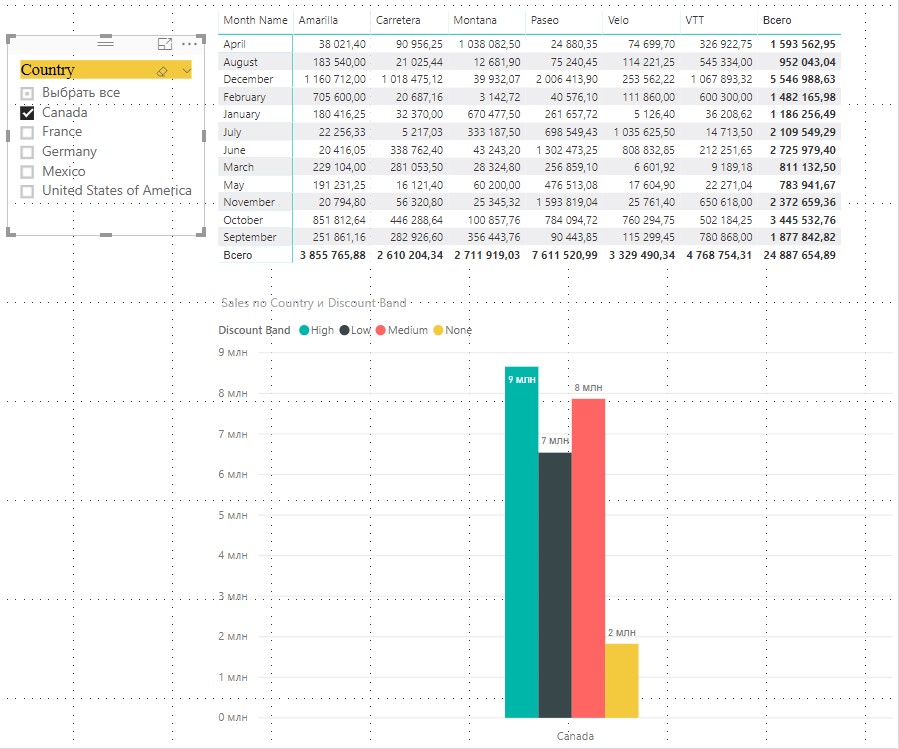
A matrix and histogram will be created on the landing page.
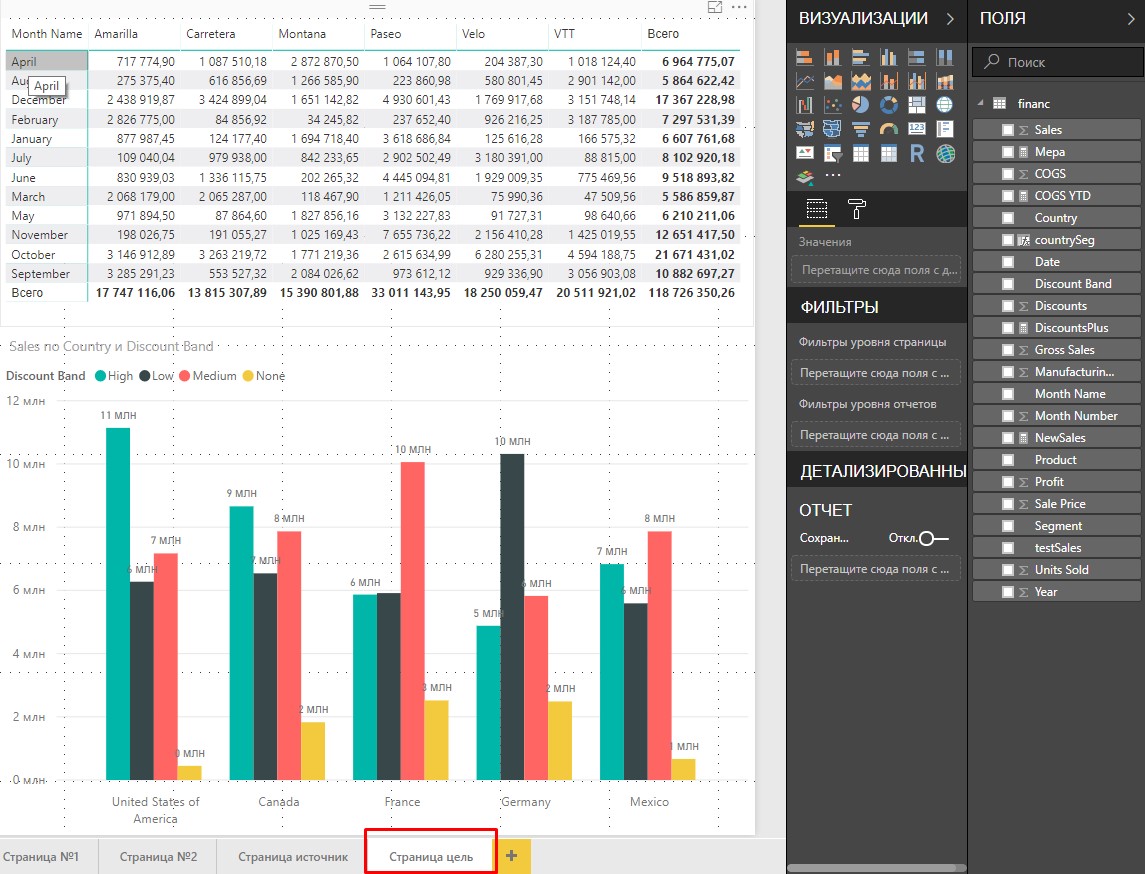
The matrix consists of the following fields: Month name; Product; Sales.
The histogram includes the fields: Country; Discount Band; Sales.
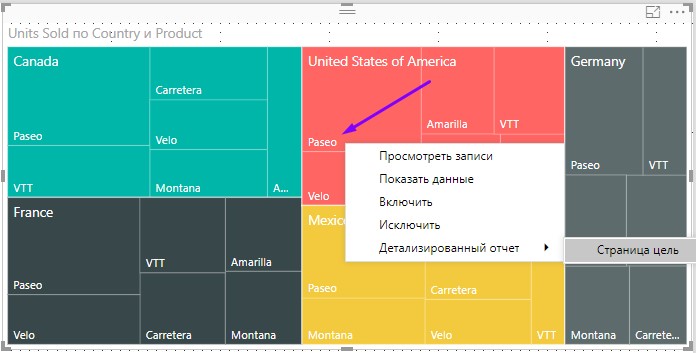
On the source page there will be a bar chart and a tree diagram.
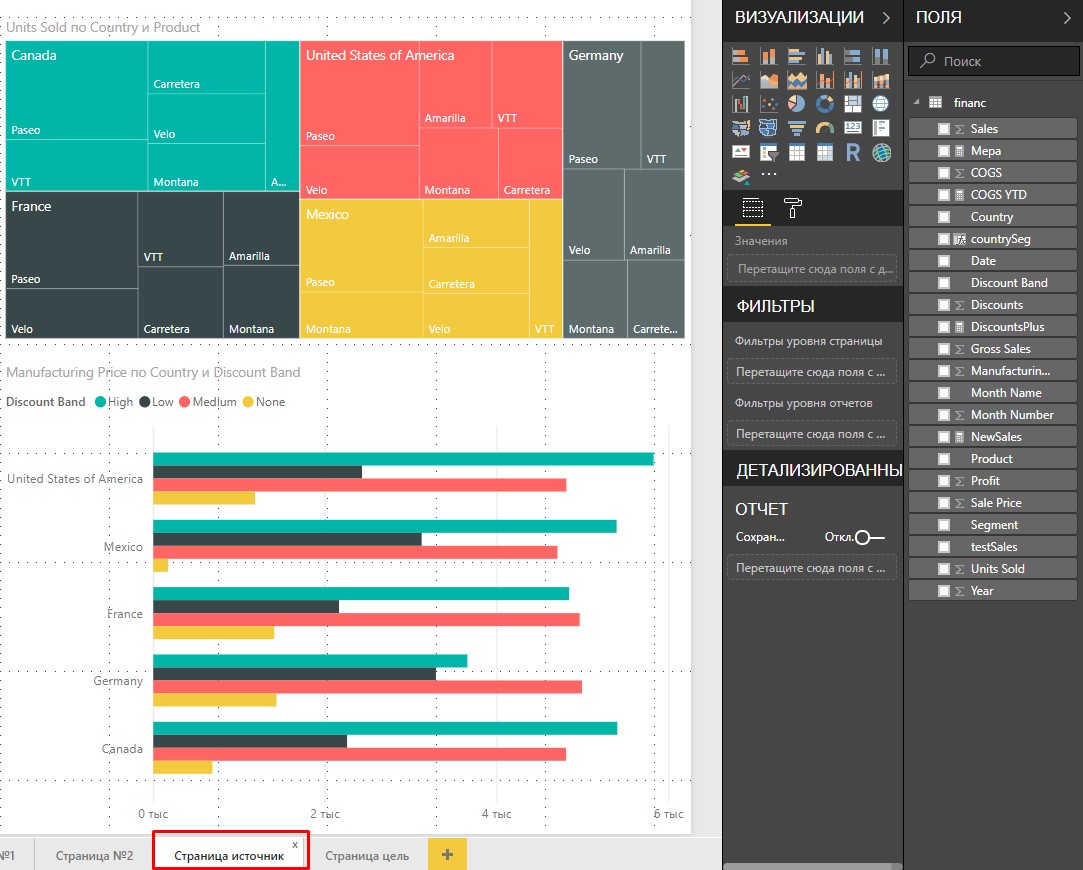
The tree diagram includes the fields: Country; Product; Units Sold.
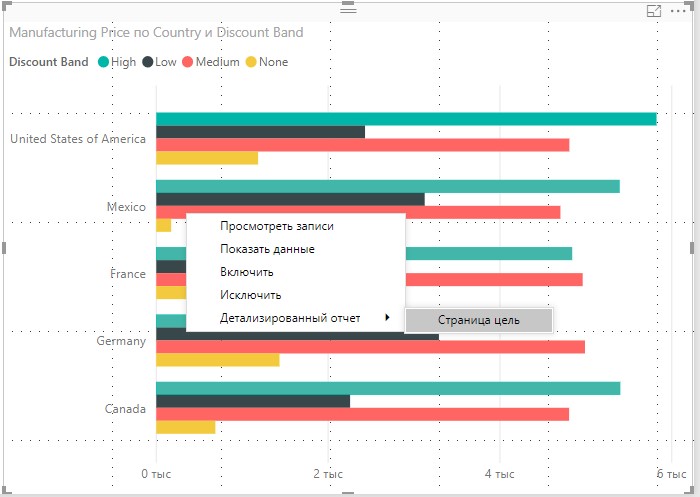
The histogram consists of the following fields: Country; Discount Band; Manufacturing Price.
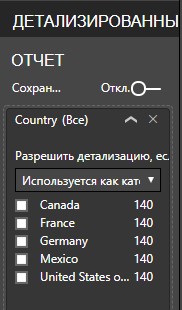
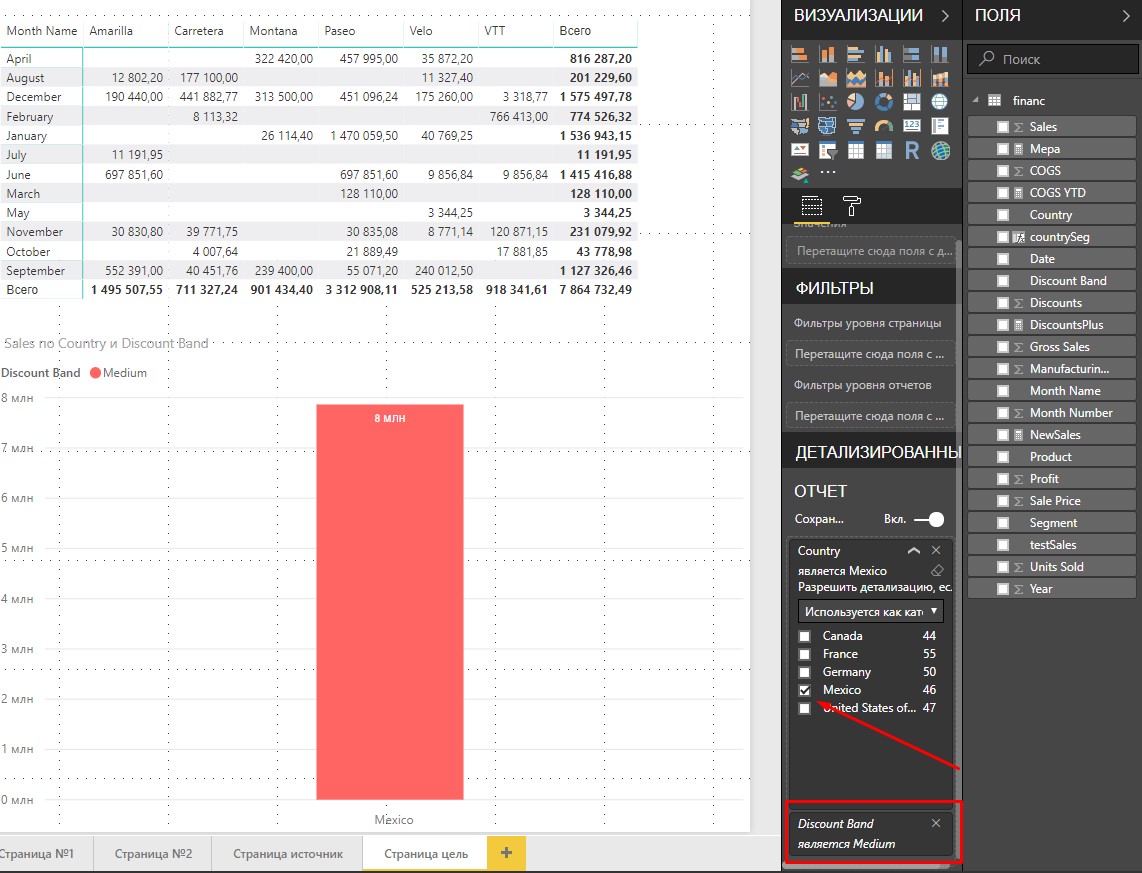
Now on the target page, drag the Country field to the "DETAILED" area.
This will allow you to go to the “Target” page, with the visualization in which the Country field is used.
On the source page, right-click on the tree in the USA area and
select the detailed report -> Page target.

This will take us to the “Target” page with filtered visuals by United States of America in the Country field. Both visuals have changed their appearance.

Until the May PBI Desktop update, any other filters that are not listed in the "DETAILS" area will not be transferred to the "Target" page. This means that filtering by the Product field in the tree diagram is enabled when selecting the “Detailed report” option.
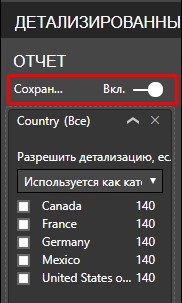
With the May update, you can specify the preservation of all filters when selecting details.
We will now repeat this action. We right-click on the US area and the Paseo area.
The result of the transition to the page "Goal".

Pay attention to the visual elements, they are now filtered by the Country and Product fields. In the "DETAILS" area, a filter appeared across the Product = Paseo field.
The same will happen if on the “Source” page you select the details on the histogram.
The result of filtering the "Goals" page.
Eventually:
We received quite a good extension of the report filtering feature. Now we can choose, we want to declare filters explicitly and block all the rest, or we want to pass data on the detail page through all filters.
Improved synchronization of slicers (filters)
May update has expanded the ability to synchronize filters.
Run the sync panel.

Create a filter on the Country field.

Now we will copy the filter into several pages. When copying, you will be prompted to synchronize the filters on different pages. If we accept it, then filters on all pages where we copy it will work as one.

Now we will filter the page by value Canada.
Another page will be filtered by Canada. Filters worked synchronously.

We can see the work of synchronized filters on the sync panel.

The right column means that the filters are visible on the pages, the left column shows the synchronization of filters by pages. In the example there are synchronized filters on pages 2 and 3.
We can synchronize filters by groups.
We have visuals on 4 pages and we want to synchronize the filter on pages 1 and 4, as well as synchronize the filters on pages 2 and 3.
To do this, you can write filters to the group.
Turn to page 2 and select the filter. On the sync panel in the Advanced Options tab, we will see that the filter is recorded in a group called Country. The group is named after the name of the filter automatically after the creation of synchronization.

The filter on page 3 is recorded in the same group.
Now we will copy the filter on pages 1 and 4. When you request a synchronization, we will refuse it.
Now on pages 1 and 4 in the filters we enter the name of the group Country_new.

If we compare two pictures, we will see that we have two filter groups: the Country group takes pages 2 and 3 and the Country_new group takes pages 1 and 4.
When we filter the relevant pages, we will notice the changes on the pages synchronized with them. Filters in different groups act independently.
Eventually:
There was an interesting possibility that one filter can be synchronized differently on different pages. Also, one filter can filter out visuals in different ways.
New design for Power BI Service
On May 14, 2018, information appeared that now in the Power BI cloud solution for dashboards (dashboards) additional design options have appeared.
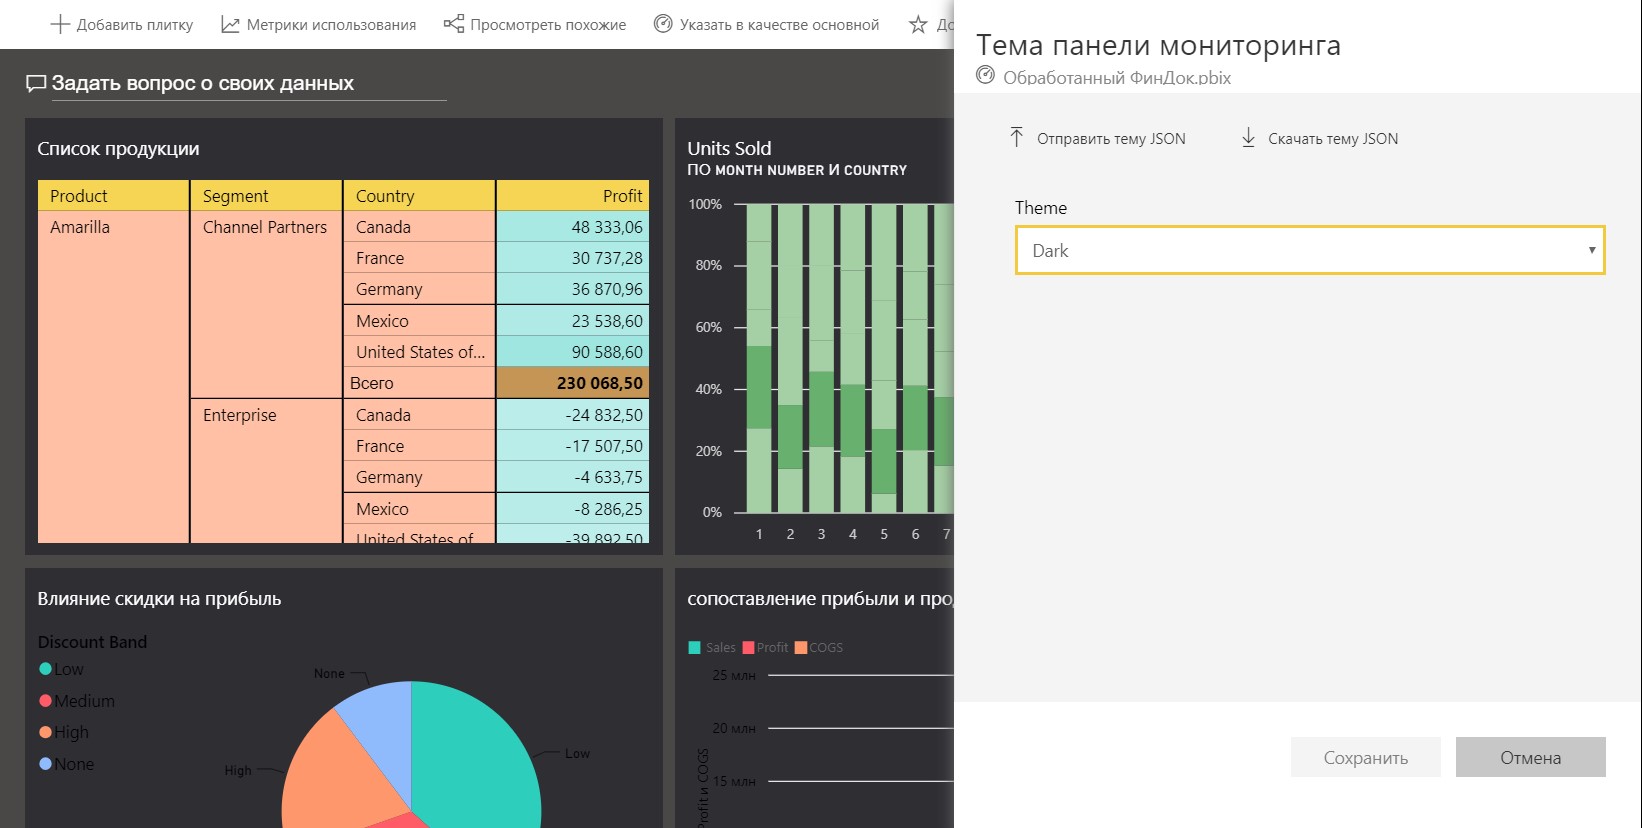
We can go to Power BI and go to our workspace under your account. We will open the dashboard and click the ellipsis in the upper right corner of the screen. We will have a menu where there is a line “Dashboard theme”.
We will have a window with options for choosing colors for decorating dashboards. 3 colors are standardly available: light (Light) (it is always the default for panels), dark (Dark) and “Color-bling friendly”.
You can also create your own colors by choosing Custom.
Here's what it looks like:

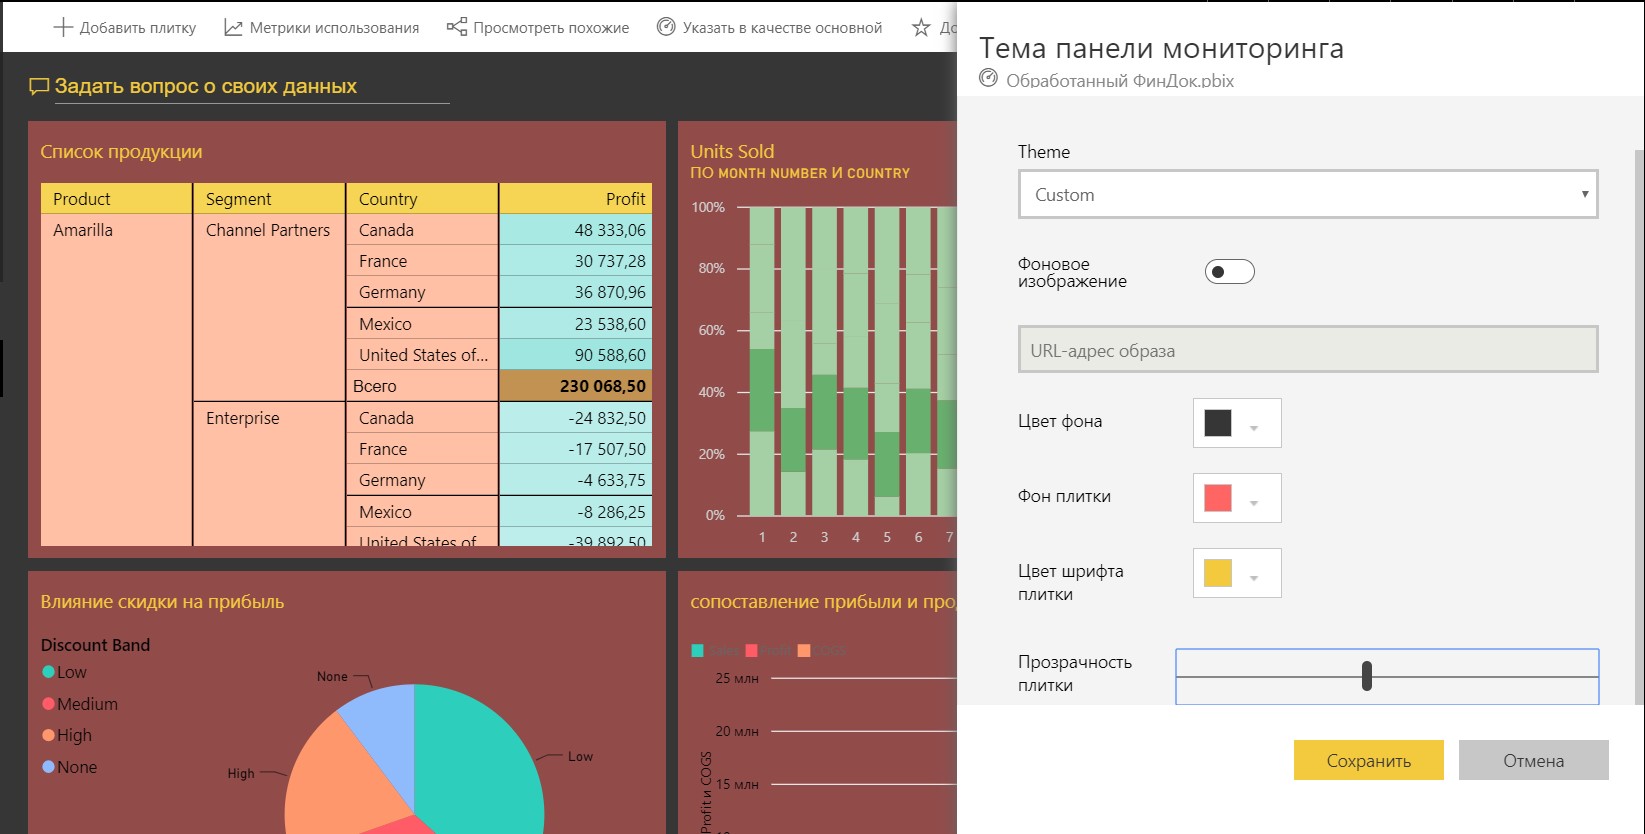
You can customize:
- Toolbar background color
- Tile background color
- Tile font color
- Tile transparency
There is still a way to upload a JSON file with colors for the tiles. The theme file is a JSON file that includes all the colors you want to use for your toolbar.
JSON file for thematic panels includes:
- name - the name of the topic
- foreground and background - Toolbar colors
- dataColors - a list of used hexadecimal code for data in charts. You can choose as many colors as you like.
- tiles - Background and color configurations for toolbars
- visualStyles - Granular formatting for visual effects.
Here is an example JSON file for the default Light theme:
{ "name":"Light", "foreground":"#000000", "background":"#EAEAEA", "dataColors":["#01B8AA","#374649","#FD625E","#F2C80F","#5F6B6D","#8AD4EB","#FE9666","#A66999"], "tiles":{"background":"#FFFFFF","color":"#000000"}, "visualStyles":{"*":{"*":{"*":[{"color":{"solid":{"color":"#000000"}}}]}}} }
A blog article about updating those dashboards.Eventually:
Power BI Service users can work with dashboards, making them not monotonous sets of tablets and graphs, but create beautifully designed data presentation panels.