Hi, Habr! We finally got another part of a series of materials from a graduate of our
Big Data Specialist and
Deep Learning programs, Cyril Danilyuk, about using the currently popular Mask R-CNN neural networks as part of an image classification system, namely assessing the quality of the cooked dish using a set of data from sensors.
Having considered in the
previous article a toy dataset consisting of images of road signs, we can now proceed to solving the problem I faced in real life:
“Is it possible to implement a Deep Learning algorithm that could distinguish high-quality dishes from bad dishes one by one? photos? In short, the business wanted this:
What is business when thinking about machine learning:This is an example of an incorrectly assigned task: in this case it is impossible to determine whether a solution exists, is unique and stable. In addition, the very formulation of the problem is very vague, not to mention the implementation of its solution. Of course, this article is not devoted to the effectiveness of communications or project management, however, it is important to note:
never touch projects in which the final result is not defined and fixed in the ToR. One of the most reliable ways to cope with such uncertainty is to first build a prototype, and then, using new knowledge, to structure the rest of the task. That is what we did.
Formulation of the problem
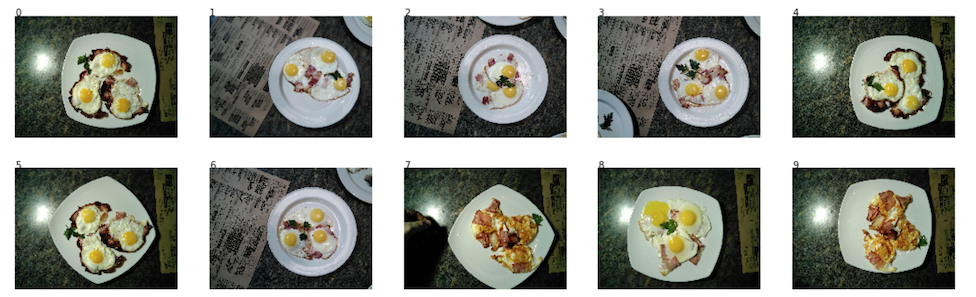
In my prototype, I focused on one dish from the menu — the omelet — and built a scalable pipeline that determines the output of the omelet. This can be described in more detail as follows:
- Task type: multiclass classification with 6 discrete quality classes: good (good), broken_yolk (with spreading yolk), overroasted (overcooked), two_eggs (from two eggs), four_eggs (from four eggs), misplaced_pieces (with pieces scattered on a plate) .
- Data set: 351 manually collected photographs of various omelettes. Training / validation / test sample: 139/32/180 mixed photos.
- Labels of classes: each photo corresponds to a class label corresponding to a subjective assessment of the quality of an omelet.
- Metric: categorical cross-entropy.
- Minimal domain knowledge: the “quality” omelet should look like this: it consists of three eggs, a small amount of bacon, a parsley leaf in the center, it has no spread yolks and fried pieces. Also, the overall composition should “look good”, that is, the pieces should not be scattered across the plate.
- Completion criterion: the best cross-entropy value on the test sample among all possible after two weeks of prototype development.
- The way to final visualization: t-SNE on a data space of a smaller dimension.
 Input Images
The main goal of the pipeline is to learn how to combine several types of signals (for example, images from different angles, a heat map, etc.), getting a pre-compressed representation of each of them and passing these features through a neural network classifier for the final prediction. So, we will be able to realize our prototype and make it practically applicable in further work. Below are several signals used in the prototype:
- Mask key ingredients (Mask R-CNN): Signal number 1 .
- The number of key ingredients in the frame., Signal №2 .
- RGB-crops plates with scrambled eggs without a background. For simplicity, I decided not to add them to the model yet, although they are the most obvious signal: in the future, you can train the convolutional neural network for classification using some adequate triplet loss function, calculate image embeddings and cut L2 from the current images up to the perfect. Unfortunately, I was not able to test this hypothesis, since the test sample consisted of only 139 objects.
General view of pipeline
I note that I will have to skip a few important steps, such as exploration data analysis, building a basic classifier and active labeling (I have proposed a term that means semi-automatic annotation of objects, inspired by the
Polygon-RNN demo video ) Pipeline for Mask R-CNN (more about this in the following posts).
Take a look at the whole pipeline as a whole:
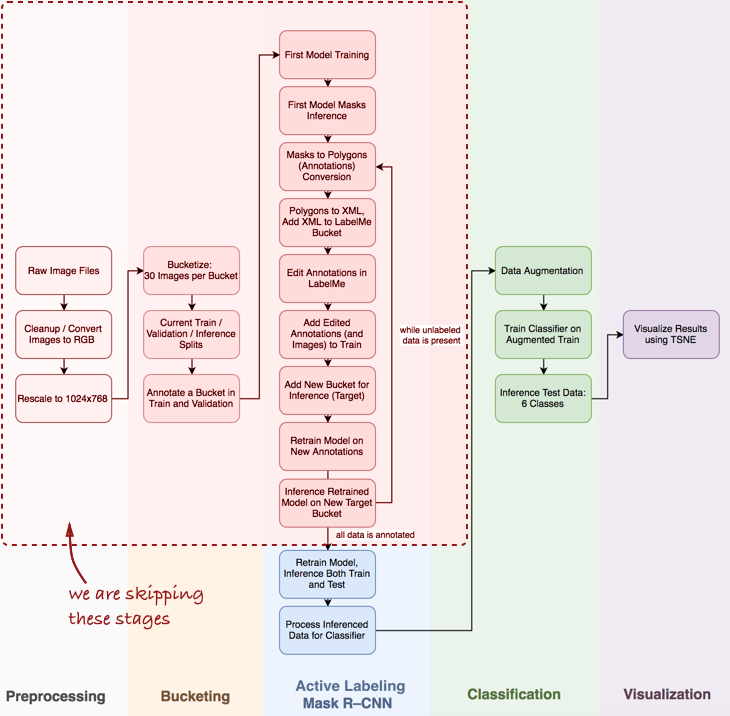 In this article, we are interested in the stages of Mask R-CNN and classification within the pipeline.
Next, we will look at three stages: 1) using Mask R-CNN to build masks of omelet ingredients; 2) ConvNet classifier based on Keras; 3) visualization of results using t-SNE.
Stage 1: Mask R-CNN and Mask Building
Mask R-CNN (MRCNN) recently are at the peak of popularity. Starting from the original
Facebook article and ending with the
Data Science Bowl 2018 on Kaggle, Mask R-CNN has established itself as a powerful architecture for instance segmentation (i.e., not only per-pixel image segmentation, but also the separation of several objects belonging to the same class ). In addition, it is a pleasure to work with the
implementation of Matterport's MRCNN in Keras. The code is well structured, has good documentation and works right out of the box, albeit more slowly than expected.
In practice, especially when developing a prototype, it is crucial to have a pre-trained convolutional neural network. In most cases, the data scientist's set of labeled data is very limited, or not at all, while ConvNet requires a large amount of labeled data in order to achieve convergence (for example, the ImageNet data set contains 1.2 million labeled images). Here
transfer learning comes to the rescue: we can fix the weights of the convolutional layers and only train the classifier. Fixing convolutional layers is important for small datasets, since this technique prevents retraining.
Here is what I received after the first pre-training era:
 Object segmentation result: all key ingredients are recognized.
In the next phase of the pipeline (
Process Inferenced Data for Classifier ), you need to cut out the part of the image that contains the plate, and extract the two-dimensional binary mask for each ingredient on this plate:
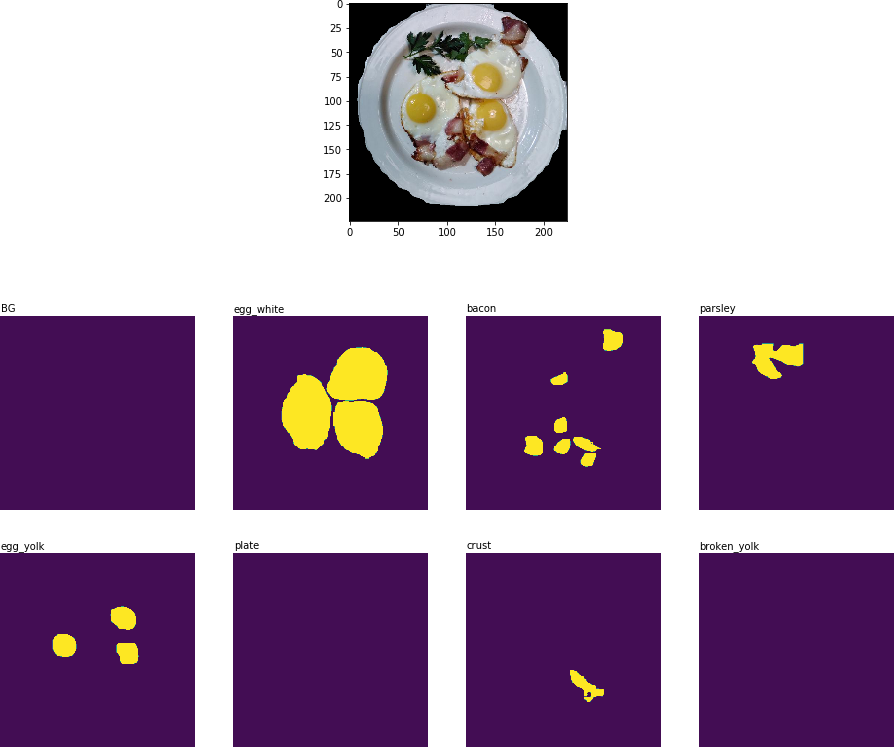 Crops images with key ingredients in the form of binary masks
These binary masks are then combined into an 8-channel image (since I defined 8 classes of masks for MRCNN), and we get
Signal # 1 :
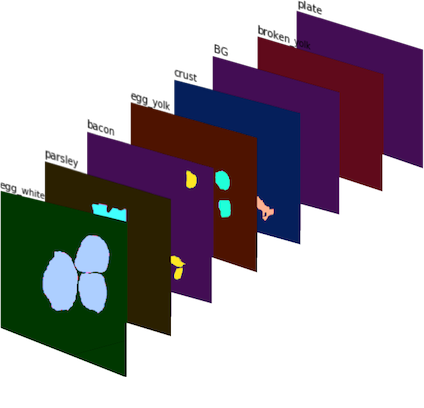 Signal number 1 : 8-channel image consisting of binary masks. In color for better visualization
To get the
Signal number 2 , I counted the number of times that each ingredient is found on the crock of the plate and got a set of vector-signs, each of which corresponds to its cropp.
Stage 2: The ConvNet Classifier at Keras
The CNN classifier was implemented from scratch using Keras. I wanted to combine several signals (
Signal No. 1 and
Signal No. 2 , as well as the possible addition of data in the future) and allow the neural network to predict the quality of the dish. The following architecture is a trial and far from ideal:

A few words about the classifier architecture:
- Multiscale convolutional module : I initially chose a 5x5 filter for convolutional layers, but this only resulted in a satisfactory result. Improvements were achieved by applying AveragePooling2D to several layers with different filters: 3x3, 5x5, 7x7, 11x11. An additional 1x1 convolutional layer was also added in front of each of the layers to reduce the dimension. This component is a bit like the Inception module , although I did not plan to build a network that is too deep.
- Larger filters : I used larger filters because they help to more easily extract larger scale features from the input image (which is essentially an 8-filter activation layer — the mask for each ingredient can be viewed as a separate filter).
- Combining signals : in my naive implementation, only one layer was used, which combined two sets of features: processed binary masks ( Signal No. 1 ) and counted ingredients ( Signal No. 2 ). However, despite its simplicity, the addition of Signal No. 2 made it possible to reduce the cross-entropy metric from 0.8 to [0.7, 0.72] .
- Logits : in terms of TensorFlow, logit is the layer on which tf.nn.softmax_cross_entropy_with_logits is applied to calculate batch loss .
Stage 3: Visualize Results with t-SNE
To visualize the results of the classifier on the test data, I used t-SNE - an algorithm that allows you to transfer the original data into a space of a smaller dimension (to understand the principle of the algorithm, I recommend reading
the original article , it is extremely informative and well written).
Before visualization, I took test images, extracted the classifier logit layer and applied the t-SNE algorithm to this dataset. Although I have not tried different values of the perplexion parameter, the result still looks quite good:
 Result of t-SNE operation on test data with classifier predictions
Of course, this approach is not ideal, but it works. However, there may be quite a few possible improvements:
- More data. Convolution networks require a lot of data, and I only had 139 images for training. Techniques such as data augmentation work fine (I used D4 or dihedral symmetric augmentation , which resulted in more than 2 thousand images), but having more real data is still extremely important.
- More suitable loss function. For simplicity, I used categorical cross-entropy, which is good because it works out of the box. The best option would be to use the loss function, which takes into account the variation within the classes, for example, the triplet loss function (see the article FaceNet ).
- Improved classifier architecture. The current classifier is essentially a prototype, the sole purpose of which is to build binary masks and combine several sets of features to form a single pipeline.
- Improved image markup. I was very careless when manually marking up images: the classifier did the job better than me on a dozen test images.
Conclusion It is necessary, finally, to recognize that a business has neither data, nor explanations, much less a clearly set task that needs to be solved. And this is good (otherwise, why should you?), Because your job is to use different tools, multi-core processors, pre-trained models and a mixture of technical and business expertise to create additional value in the company.
Start small: a working prototype can be created from several toy blocks of code, and it will significantly increase the productivity of further conversations with company management. This is the job of a data scientist to offer new approaches and ideas to business.
September 20, 2018 starts the
“Big Data Specialist 9.0” , where you, among other things, learn to visualize the data and understand the business logic behind one task or another, which will help you more effectively present the results of your work to your colleagues and management.